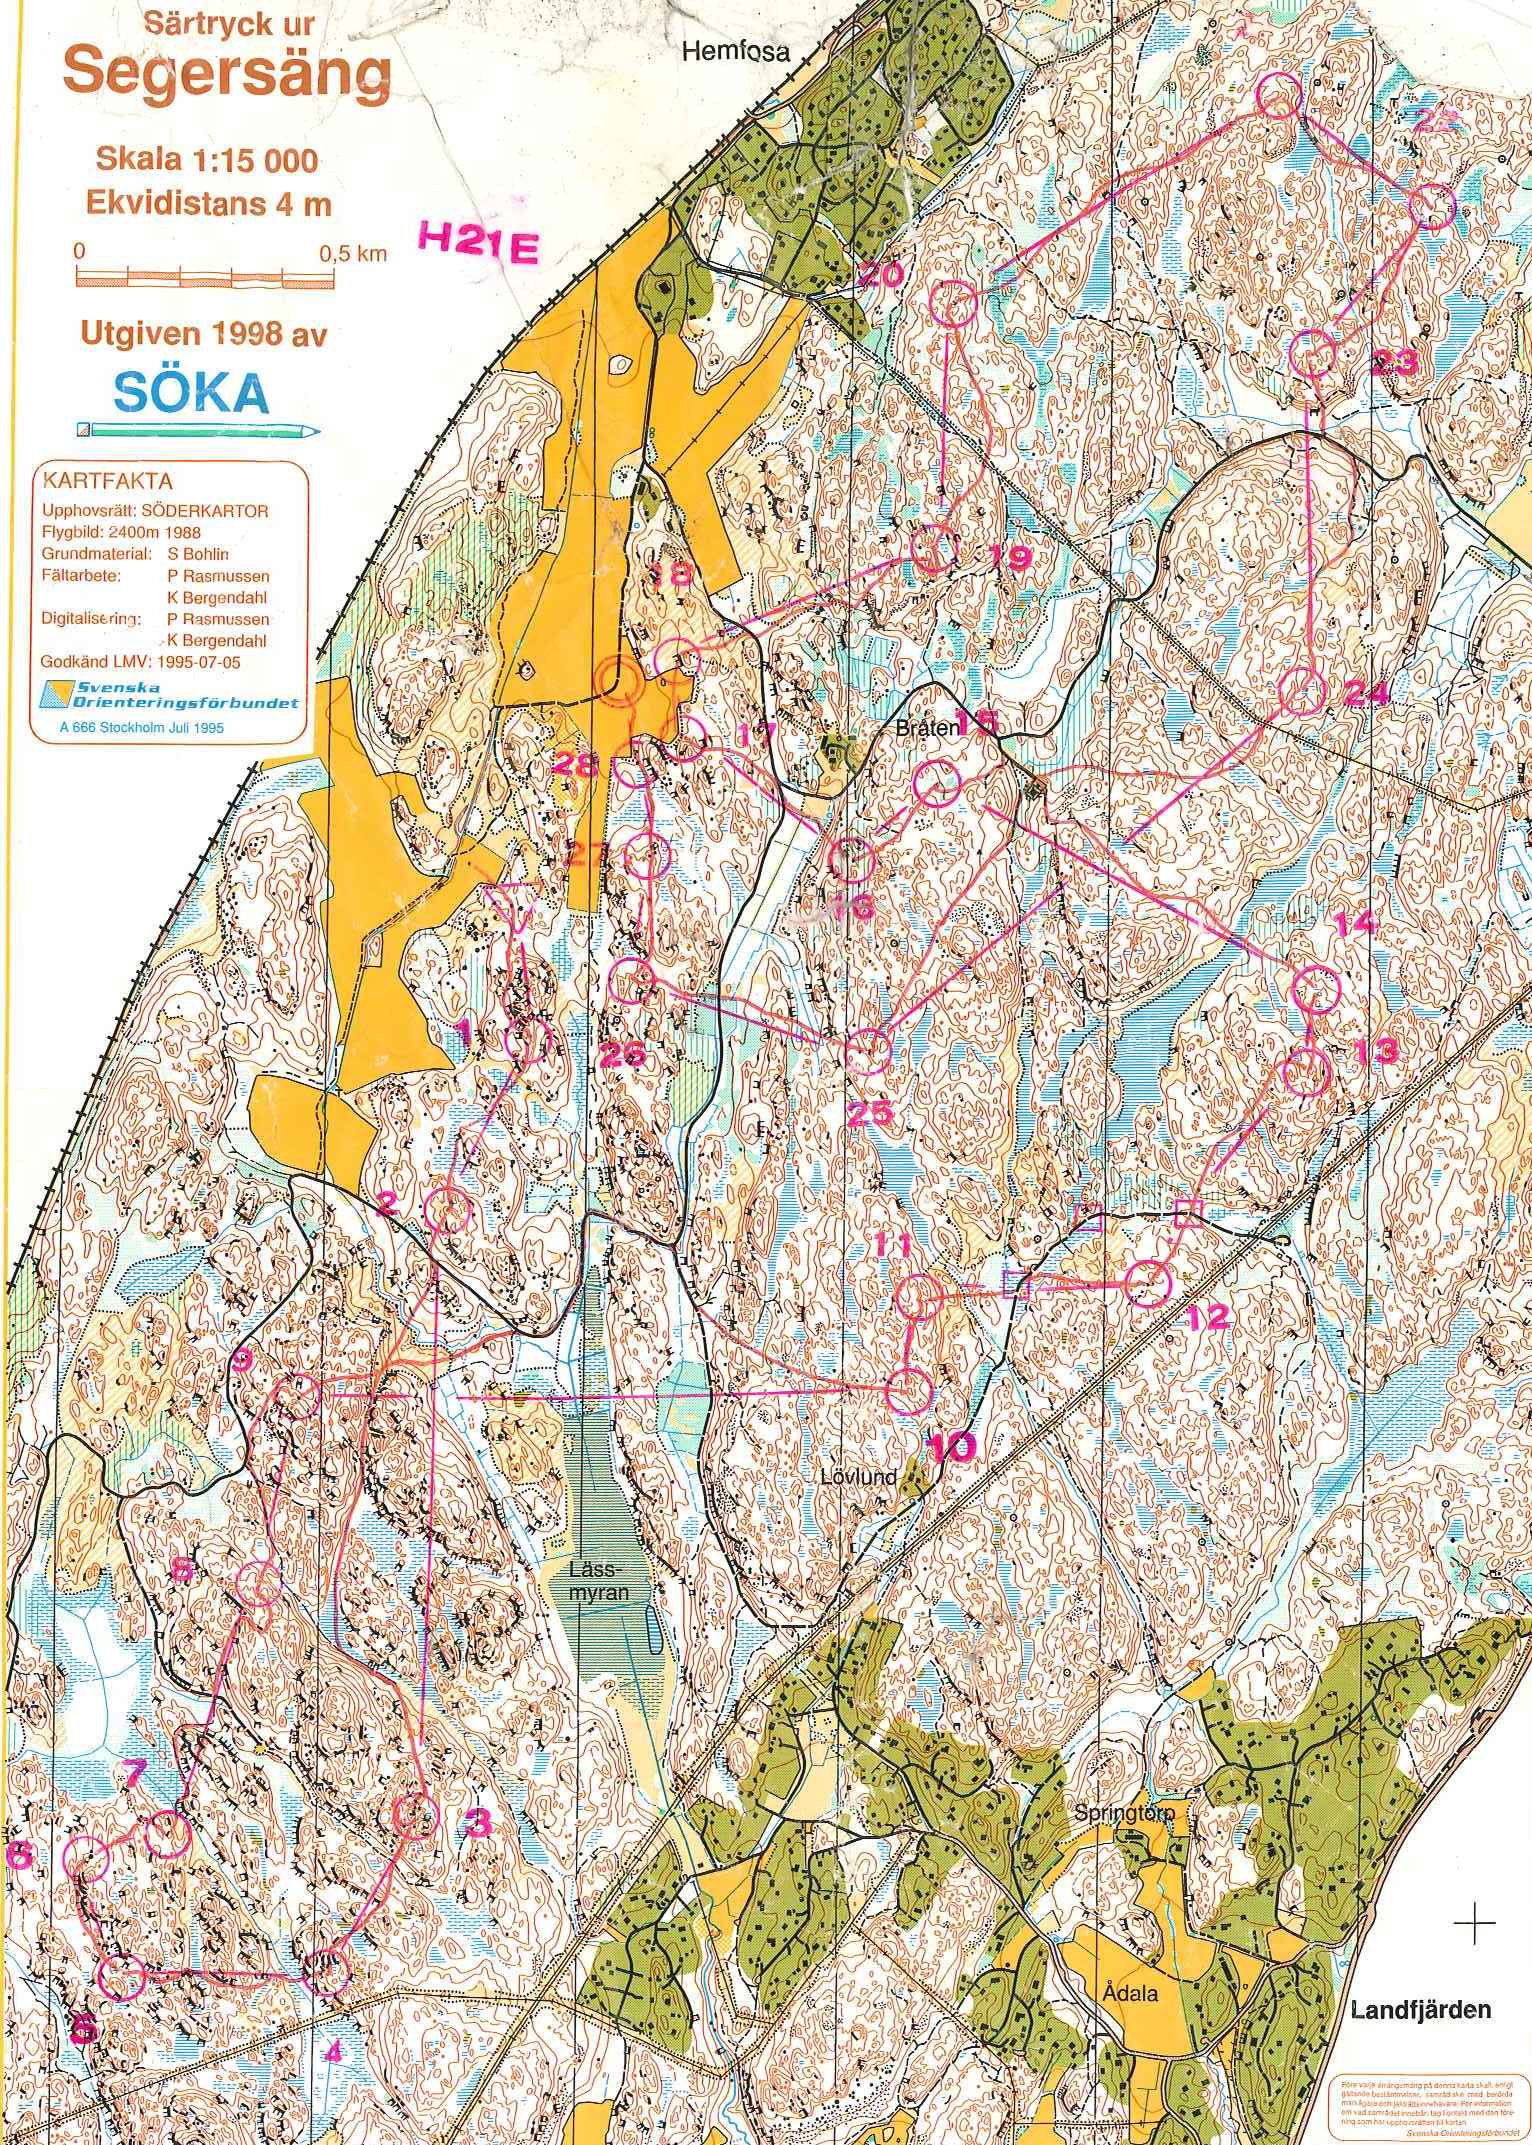
At least in Sweden there is a certain tendency to union map projects to one huge map database (f.ex. SoIK Hellas Orientering). The thereby uprising task is to handle the fact, that the so merged supermap is to big to maintain at once. Partly-Revisions must be integrated into the super-map and also the differing history of different parts (including different authors) of the map must be documented.
It might be helpful to introduce a standardized documentation layer to each map project as sketched in fig.1.
fig.1. Possible map history layer for the Hemfosa-Map. Different parts of the map have seen 0-3 so called "shallow revisions".
Do you have a good example of an "in file documentation"? - I would be interested to see it.
Posts mit dem Label hemfosa werden angezeigt. Alle Posts anzeigen
Mittwoch, 26. Juni 2013
Dienstag, 7. Mai 2013
Mappers Blog: Find the differences
Well. Here below, I add two figures of the same map excerpt and invite you to find the differences. If you are not finding them now, I sincerly hope you will notice them running... (for I spend a heck of a time on such stuff :-)
fig.1.
fig.2.
And here it goes to the solution.
fig.1.
fig.2.
And here it goes to the solution.
Montag, 1. April 2013
Mappers Blog: Cleaning up a map from 1994
As I wrote earlier, the Hemfosa map is a high quality map in regard of the mapping but has sincere deficits in regard of the drawing in OCAD. Additionally there are some things that have changed in the ISOM respectively the Swedish Mapping Norm. It is when one tries to implement these changes efficiently one notices the drawing deficits.
Tuning up the map took the following actions.
One basic idea of an OCAD-map is that each geometric object is linked to its symbolisation by a symbol number (as the symbol is linked to a color by a color number). If this linking is done properly a change in a map specification can be implemented by just importing the new norms and colors into the existing map file (OCAD10>Karte>Farben und Symbole laden von ...). This though won't work if the Symbol Numbers have changed between the last and the actual norm as in this case. I actually went through each symbol and made sure that the according symbol number is up-to-date. For the next change in the ISOM one might imagine the national federations provided their mappers with a CRT-file (a textfile with the key translation) to be used at the import of the next ISOM reference file (OCAD10>Karte>Farben und Symbole laden von ...> checkbox CRT-Datei verwenden)
Eliminate wrong symbolisations
fig.1. Not linked to the right symbol.
In the Hemfosa map there are bascially two kinds of wrong symbolisations. The first is rather easy to detect. That is if symbols outside the map norm are used as in fig.1. Here the task is to identify the right symbolisation and to relink these objects with it. (OCAD10>Legende[rechtsklick]>Selektieren nach Symbol; Legende~[linksklick auf das richtige Symbol]; OCAD10>Bearbeiten>Symbol wechseln).
The other basic case is, when the wrong symbol of the map norm was used. For example 416 cultivation boundary to draw 516 powerline. To detect those I linked certain symbols to other colors.
fig.2. 104 Slopeline and 103 formline in magenta and wrong symbolization for the formline plus slopeline in the middle of the picture fig.3.
That way I corrected most of the bugs of the drawing (f.ex. replacing 1100 wrong symbolized elongated knolls). Only the re-drawing of countless formlines, which can not be reproduced with the regular symbol i renounced to. At least I grouped them to a separate symbol and marked that one as "non-map-norm"-symbol.
fig.3. Non-map-norm symbols marked red.
Update Colors and Symbols to ISOM2000
After this basic clean up I can proceed to the update. There I import symbols and colors from a reference file. OCAD10>Karte>Farben und Symbole laden von ...>
By the way. There is another useful function to get an overview where all the difference between a map file and a reference file is written into a text file. OCAD10>Karte>Symbole und Farben vergleichen ...
Rubbersheeting the map to the new referenence system SWEREF99TM
First I set the maps coordinate system to SWEREF99TM and set the center coordinates somewhere around the maps center (OCAD10>Karte>Massstab und Koordinatensystem; fig.4).
fig.4. New coordinate system and map center
Then I choose a number of clearly identifiable points on the map an read out their coordinates (I did it form kartor.eniro.se, but of course using laser data would be the more precise solution). I draw cross-hairs at the points where the map is and where it should be (for the latter I use the tool Nummerischer Modus; fig.5).
fig.5. Reference Points for rubber-sheeting
With these points I calculate the rubber-sheeting (don't choose to may points, to close together; OCAD10>Karte>Karte transformieren>Rubbersheeting funktion; sample see fig.6).
fig.6. Visualization of a maps rubber sheeting with OCAD10 applied to a regular mesh (Map Söderby-Tumba).
Magnetic North Lines
Other than in Switzerland or Norway where maps are orientated to magnetic north, the swedish map norm says, that a map should be orientated according to the reference system SWEREF99TM. Therefore the magnetic north-lines are not parallel to the map border. To calculate the angle of these lines I have to consider magnetic declination and meridian convergence (see factsheet in german). The lines I draw with the function OCAD10>Karte>Gitterlinien where I can choose the magnetic lines angle (here -2.1).
Minimal measures
After the change of the symbolisation and the rubbersheeting it is time for the last step. The control of minimal sizes and distances. For that I modify the map symbols adding rings visualizing the minimal distances between objects according to the map norm.
fig.7-8. Visualization of minimal measures according to the swedish map norm. Magenta rings should not touch one another. Yellow rings should not touch other objects with the same color.
To enhance maps readability I divide objects being drawn to close together. As another visual control I have loaded the same map with other colors into the background. So I can check how far I dislocate the map objects (fig.9.).
fig.9. Visualized dislocation of map objects due to readability enhancement (red in the background is the primal location). In the upper left corner a virtual gap in a contour.
The dislocation usually less than 4m is pretty acceptable.
Finally and in the same turn I also correct other part of the drawing by adding corner points, map points as cutting virtual gaps into contour lines and distinct vegetation borders (OCAD10>Tool Schere & Ctrl & Click & Ziehen; see fig.9.)
So far I invested 46 hours in this process so far but ain't finished yet.
Tuning up the map took the following actions.
- Update Symbol numbers
- Eliminate wrong symbolizations
- Update Colors & Symbols
- Rubbersheet the map to the new Reference System SWEREF99TM and adding new magnetic north lines
- Implement the Swedish Mapping Norm minimal measures
One basic idea of an OCAD-map is that each geometric object is linked to its symbolisation by a symbol number (as the symbol is linked to a color by a color number). If this linking is done properly a change in a map specification can be implemented by just importing the new norms and colors into the existing map file (OCAD10>Karte>Farben und Symbole laden von ...). This though won't work if the Symbol Numbers have changed between the last and the actual norm as in this case. I actually went through each symbol and made sure that the according symbol number is up-to-date. For the next change in the ISOM one might imagine the national federations provided their mappers with a CRT-file (a textfile with the key translation) to be used at the import of the next ISOM reference file (OCAD10>Karte>Farben und Symbole laden von ...> checkbox CRT-Datei verwenden)
Eliminate wrong symbolisations
fig.1. Not linked to the right symbol.
In the Hemfosa map there are bascially two kinds of wrong symbolisations. The first is rather easy to detect. That is if symbols outside the map norm are used as in fig.1. Here the task is to identify the right symbolisation and to relink these objects with it. (OCAD10>Legende[rechtsklick]>Selektieren nach Symbol; Legende~[linksklick auf das richtige Symbol]; OCAD10>Bearbeiten>Symbol wechseln).
The other basic case is, when the wrong symbol of the map norm was used. For example 416 cultivation boundary to draw 516 powerline. To detect those I linked certain symbols to other colors.
fig.2. 104 Slopeline and 103 formline in magenta and wrong symbolization for the formline plus slopeline in the middle of the picture fig.3.
That way I corrected most of the bugs of the drawing (f.ex. replacing 1100 wrong symbolized elongated knolls). Only the re-drawing of countless formlines, which can not be reproduced with the regular symbol i renounced to. At least I grouped them to a separate symbol and marked that one as "non-map-norm"-symbol.
fig.3. Non-map-norm symbols marked red.
Update Colors and Symbols to ISOM2000
After this basic clean up I can proceed to the update. There I import symbols and colors from a reference file. OCAD10>Karte>Farben und Symbole laden von ...>
By the way. There is another useful function to get an overview where all the difference between a map file and a reference file is written into a text file. OCAD10>Karte>Symbole und Farben vergleichen ...
Rubbersheeting the map to the new referenence system SWEREF99TM
First I set the maps coordinate system to SWEREF99TM and set the center coordinates somewhere around the maps center (OCAD10>Karte>Massstab und Koordinatensystem; fig.4).
fig.4. New coordinate system and map center
Then I choose a number of clearly identifiable points on the map an read out their coordinates (I did it form kartor.eniro.se, but of course using laser data would be the more precise solution). I draw cross-hairs at the points where the map is and where it should be (for the latter I use the tool Nummerischer Modus; fig.5).
fig.5. Reference Points for rubber-sheeting
With these points I calculate the rubber-sheeting (don't choose to may points, to close together; OCAD10>Karte>Karte transformieren>Rubbersheeting funktion; sample see fig.6).
fig.6. Visualization of a maps rubber sheeting with OCAD10 applied to a regular mesh (Map Söderby-Tumba).
Magnetic North Lines
Other than in Switzerland or Norway where maps are orientated to magnetic north, the swedish map norm says, that a map should be orientated according to the reference system SWEREF99TM. Therefore the magnetic north-lines are not parallel to the map border. To calculate the angle of these lines I have to consider magnetic declination and meridian convergence (see factsheet in german). The lines I draw with the function OCAD10>Karte>Gitterlinien where I can choose the magnetic lines angle (here -2.1).
Minimal measures
After the change of the symbolisation and the rubbersheeting it is time for the last step. The control of minimal sizes and distances. For that I modify the map symbols adding rings visualizing the minimal distances between objects according to the map norm.
fig.7-8. Visualization of minimal measures according to the swedish map norm. Magenta rings should not touch one another. Yellow rings should not touch other objects with the same color.
To enhance maps readability I divide objects being drawn to close together. As another visual control I have loaded the same map with other colors into the background. So I can check how far I dislocate the map objects (fig.9.).
fig.9. Visualized dislocation of map objects due to readability enhancement (red in the background is the primal location). In the upper left corner a virtual gap in a contour.
The dislocation usually less than 4m is pretty acceptable.
Finally and in the same turn I also correct other part of the drawing by adding corner points, map points as cutting virtual gaps into contour lines and distinct vegetation borders (OCAD10>Tool Schere & Ctrl & Click & Ziehen; see fig.9.)
So far I invested 46 hours in this process so far but ain't finished yet.
Mittwoch, 27. März 2013
Mappers Blog: Hemfosa map history
Prehistory of the current map
based on Lars Palmqvists Map Archive
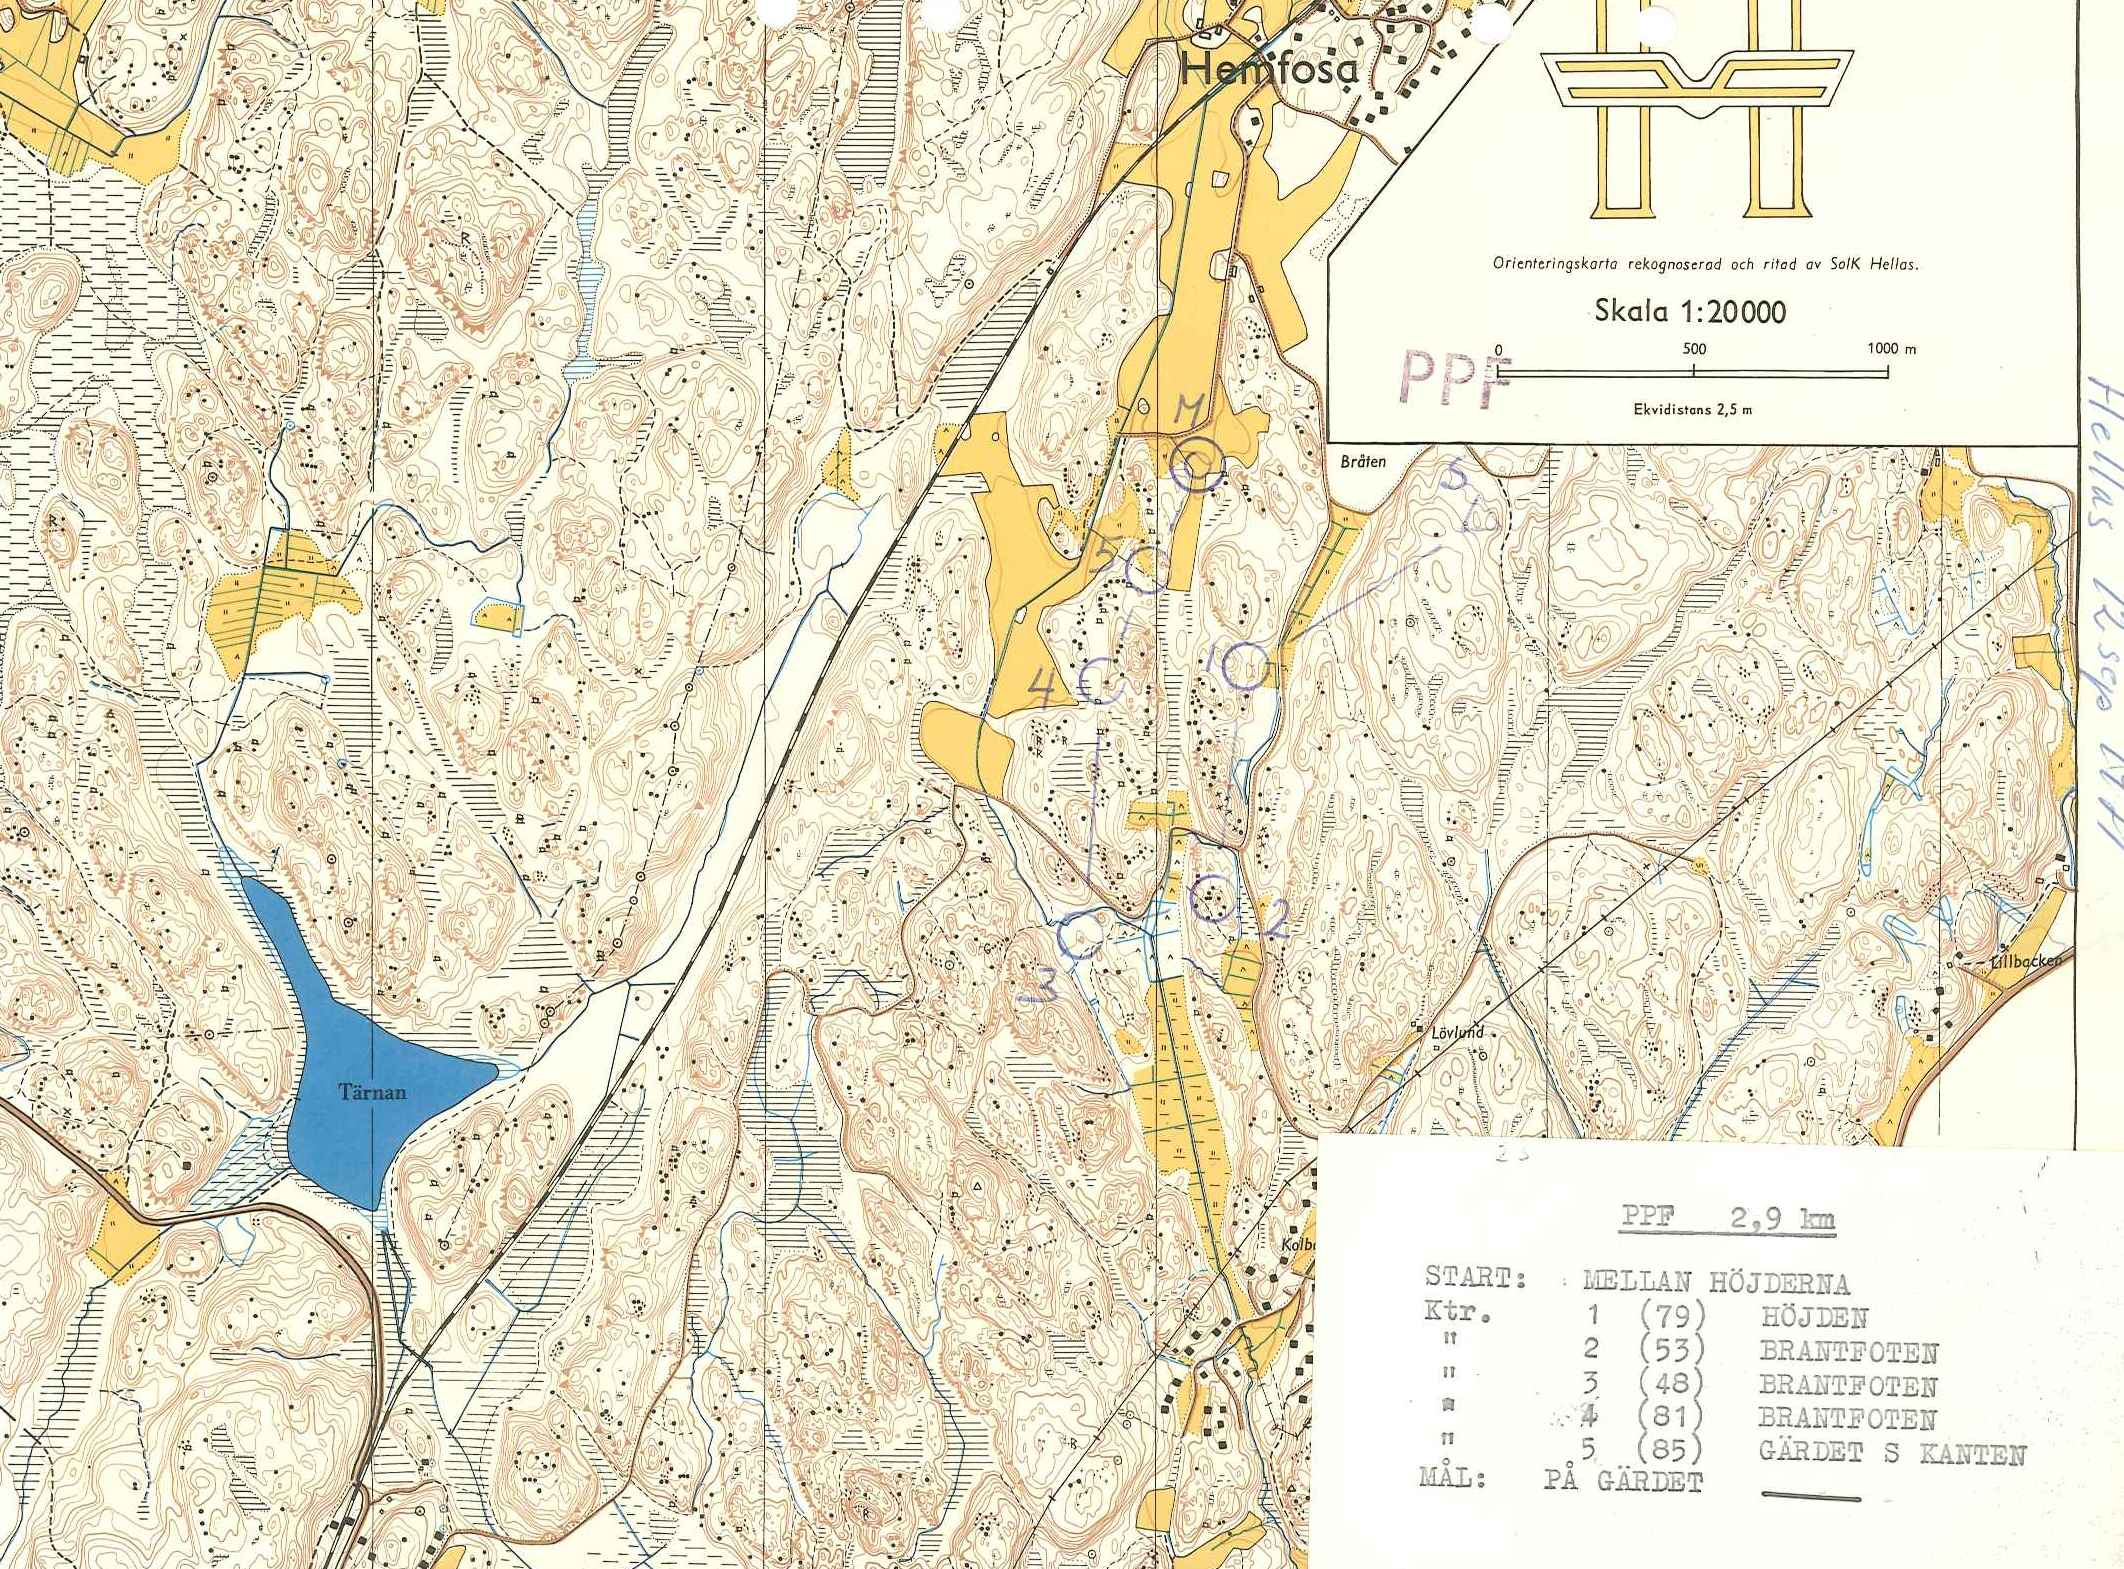
The area I am working today was first mapped before 1971 in a scale of 1:20'000 and 2.5m intervall by SoIK Hellas (no single authors mentioned).

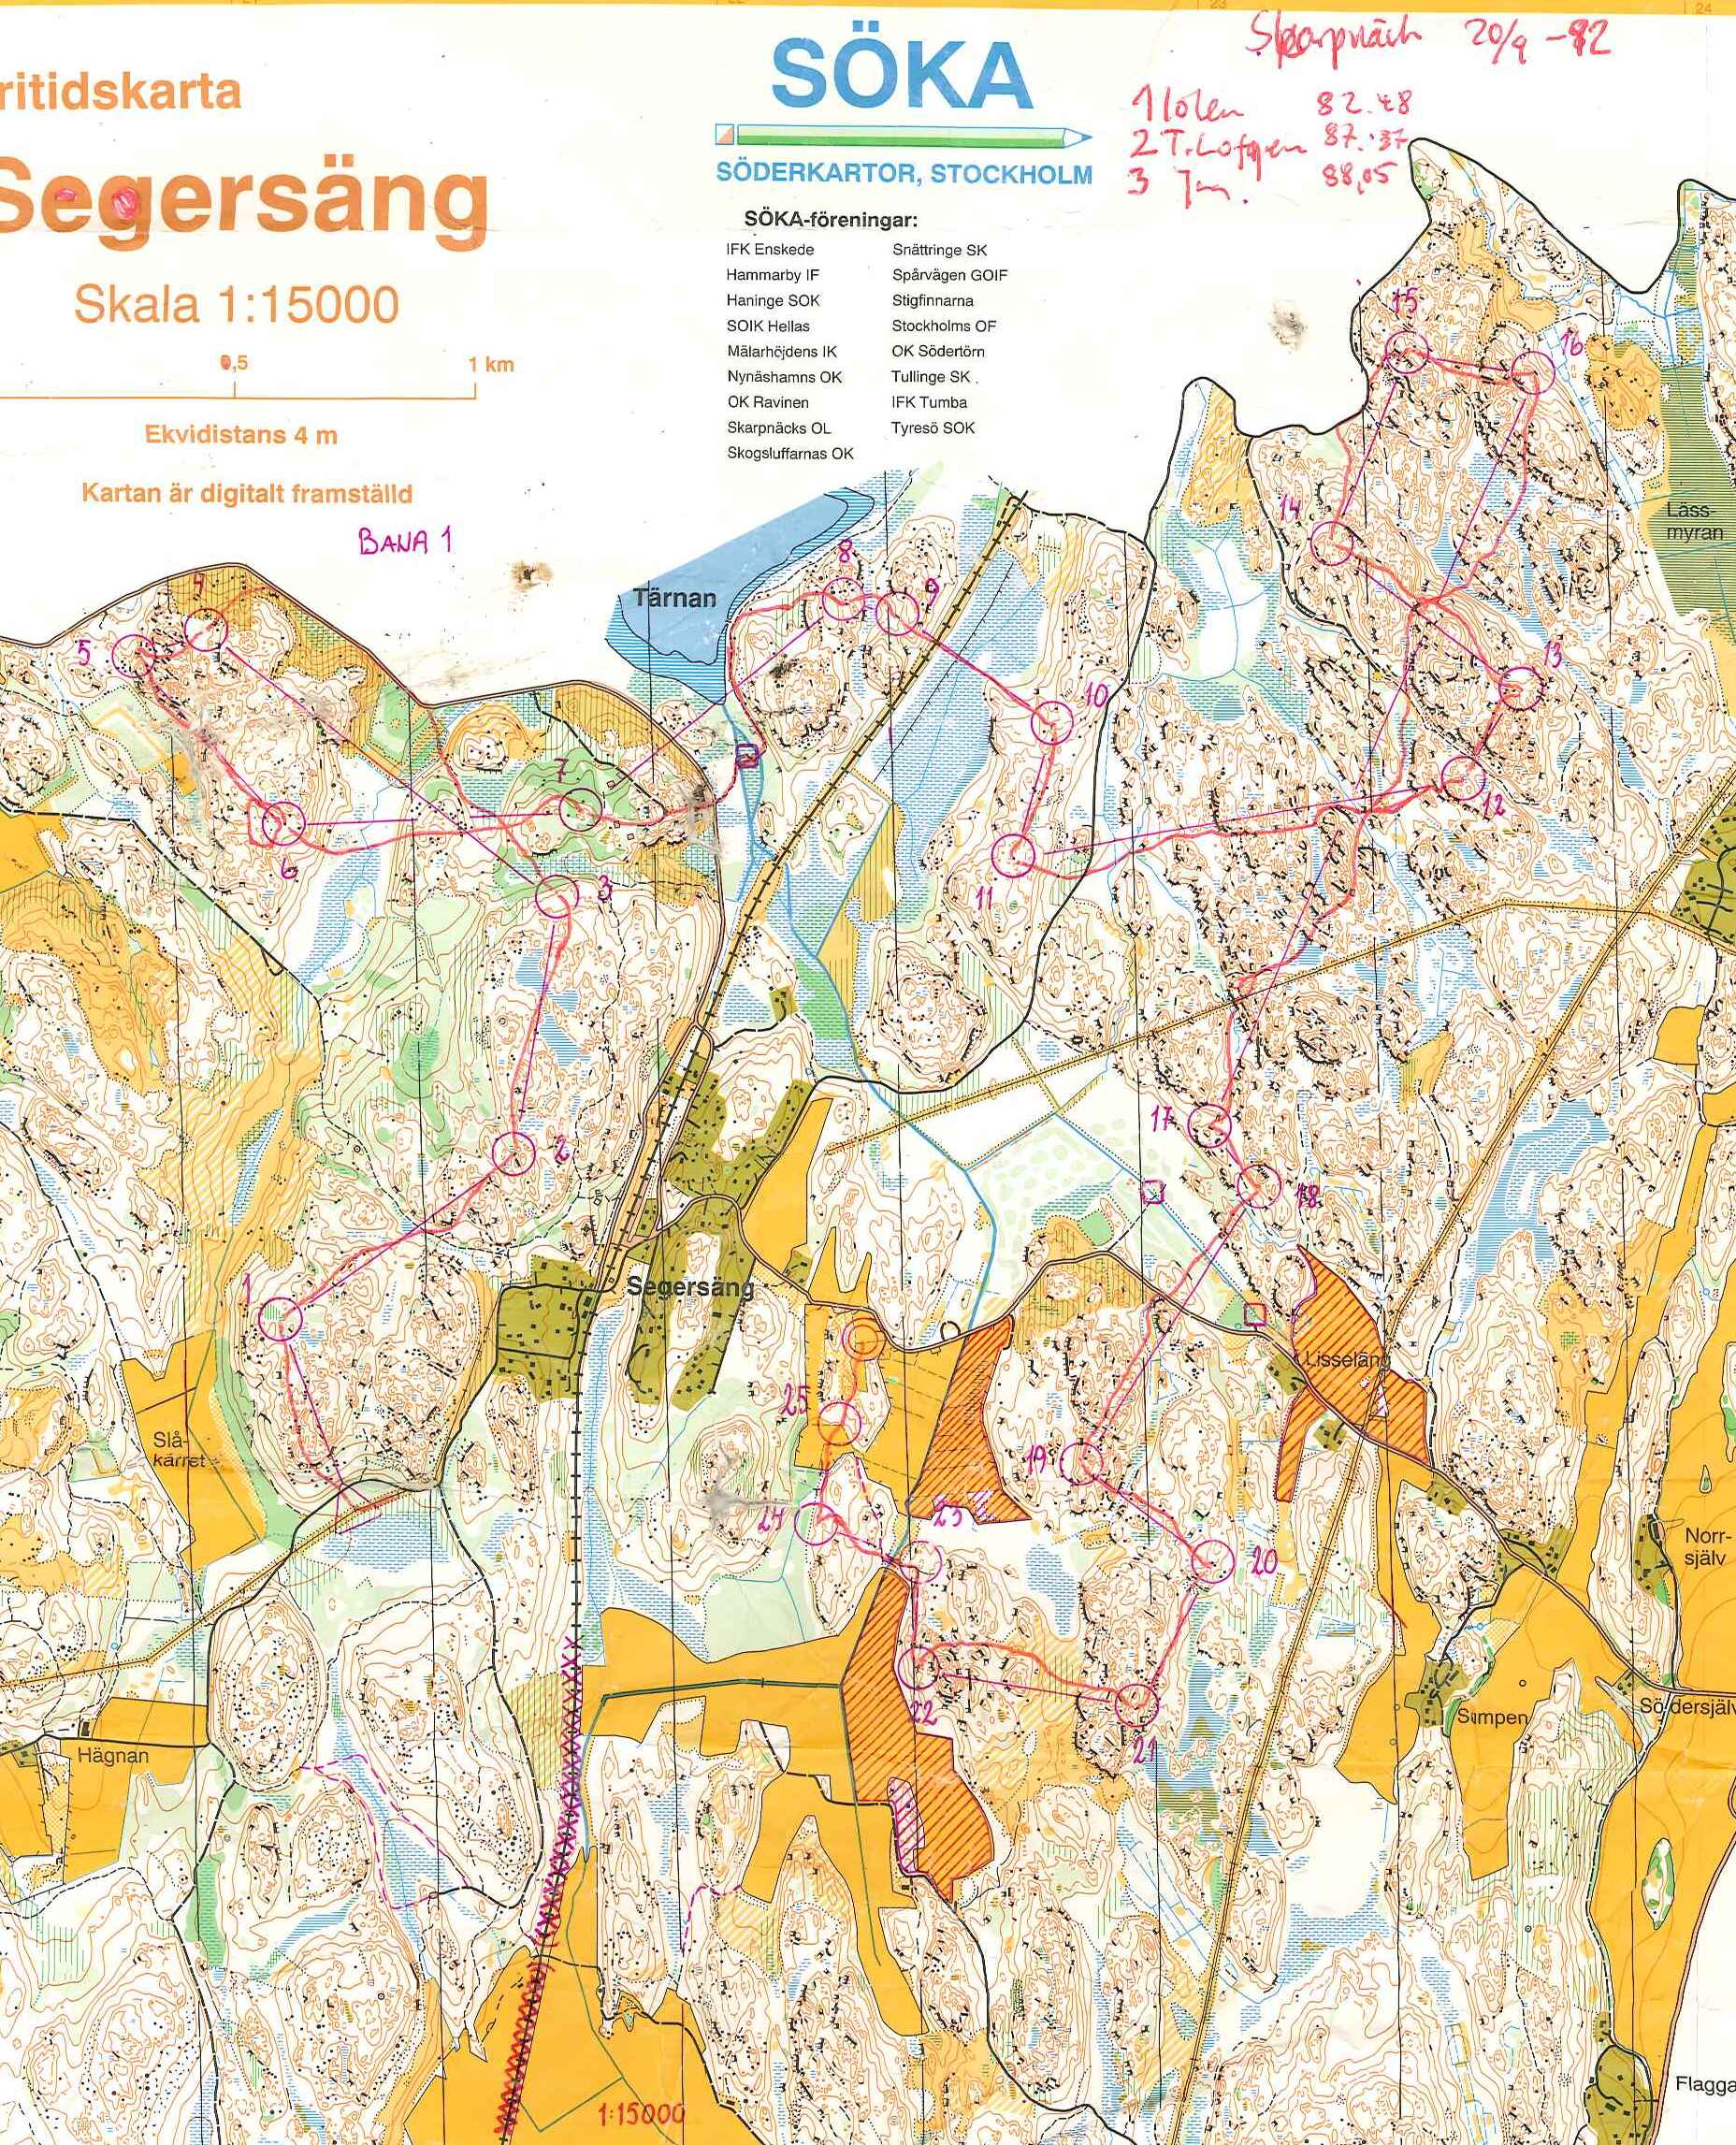
fig.1. 1971
The map itself did not follow any international standard.
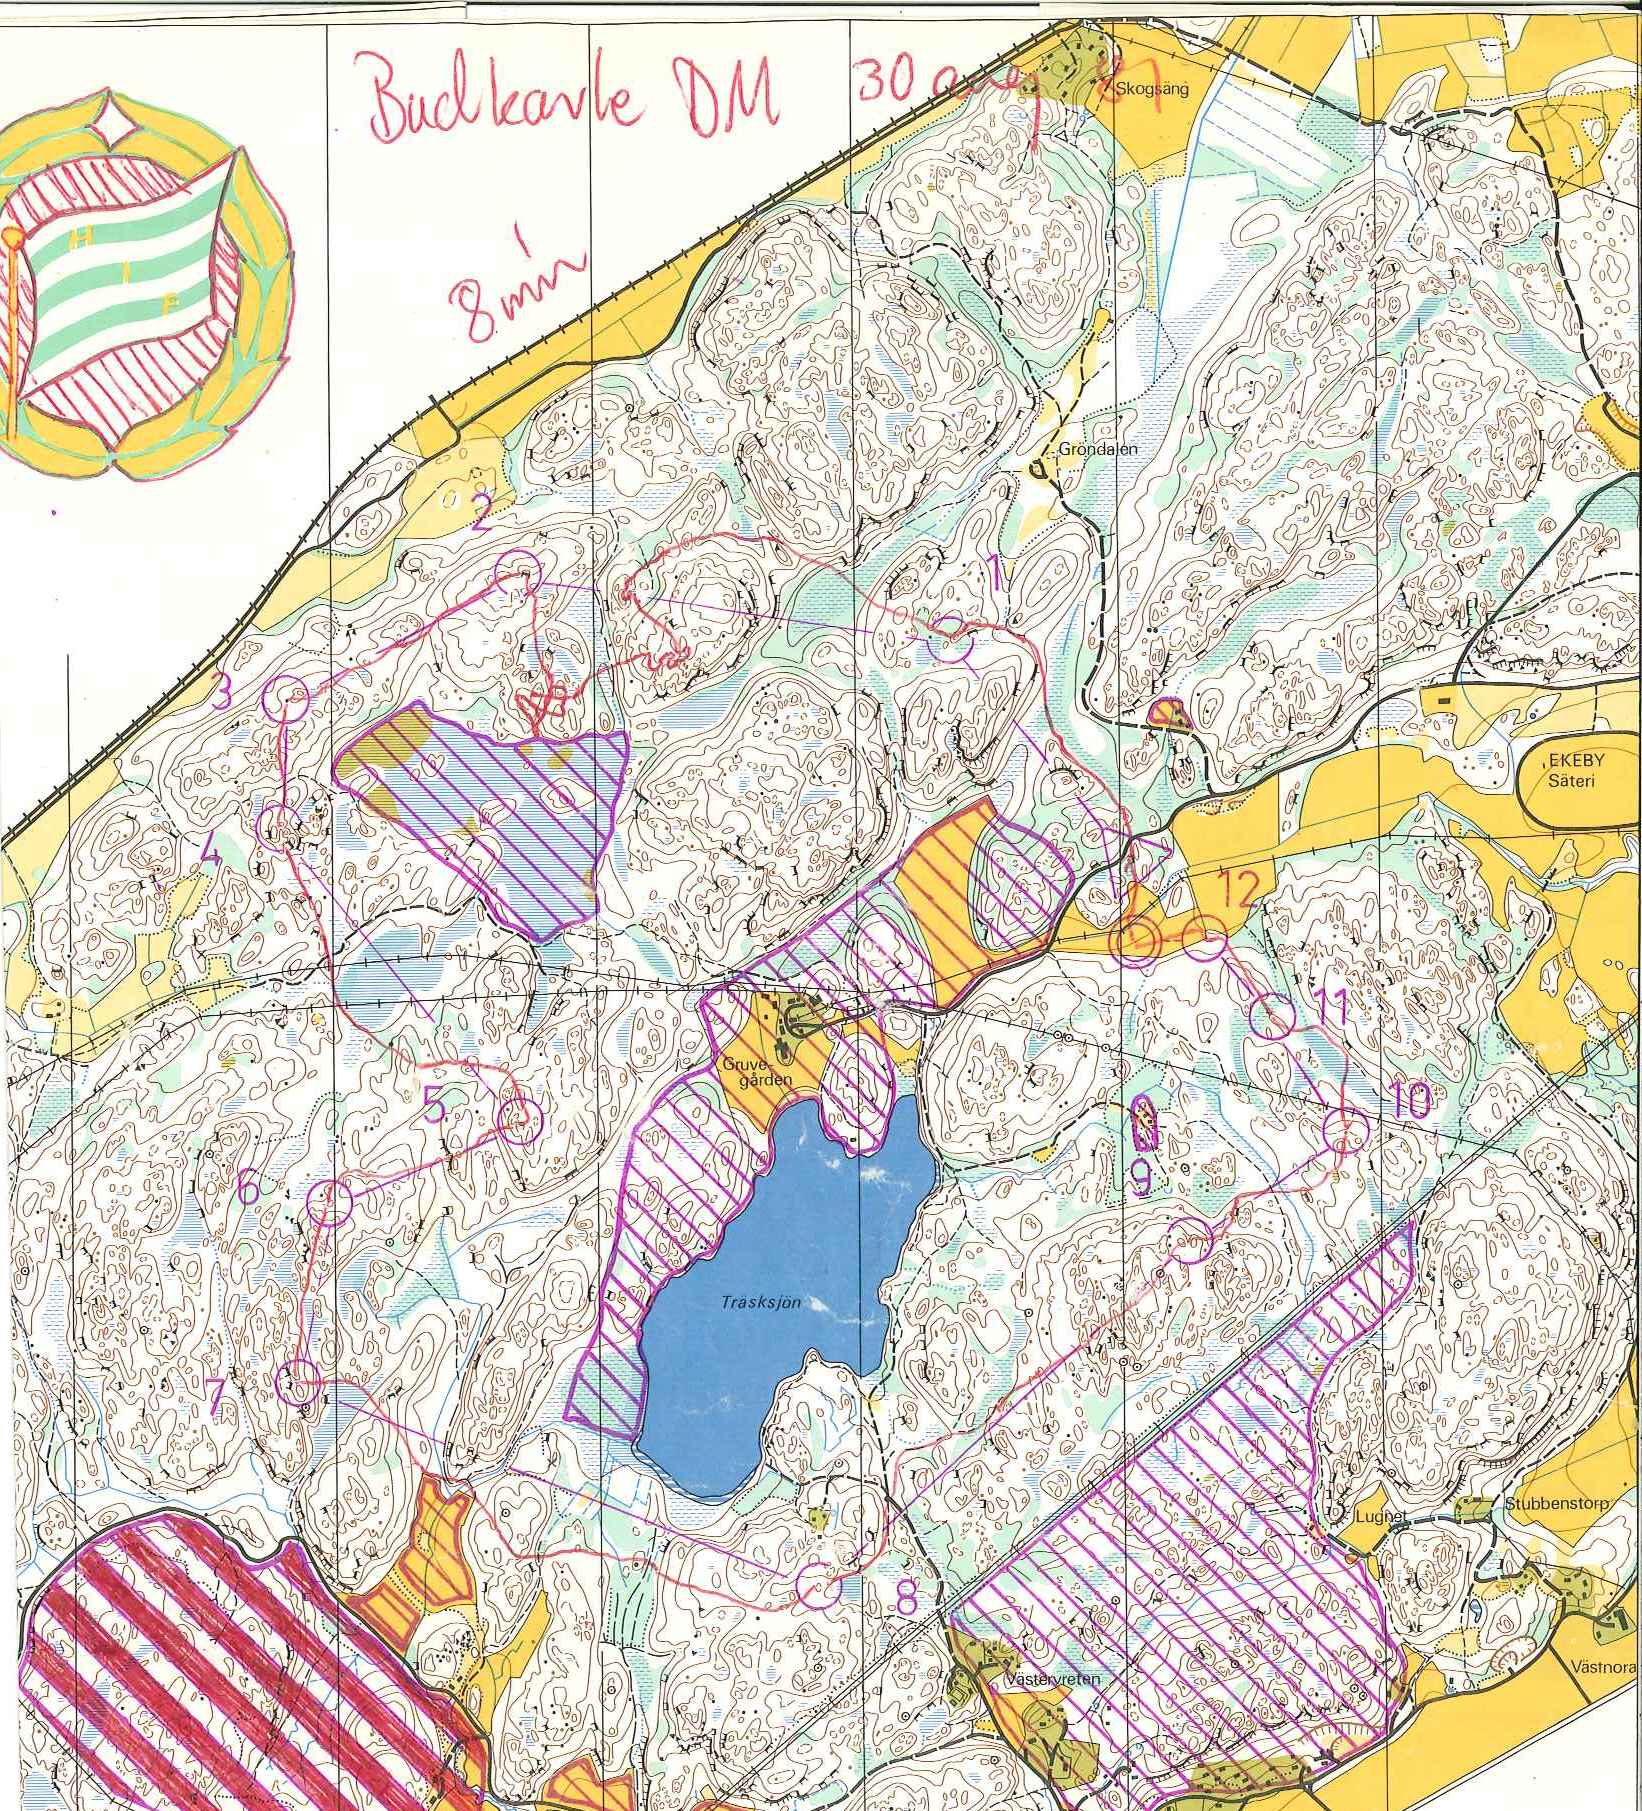
In 1977 a new map according to ISOM1975 with its new palette of runnability signatures (yellow and green) appeared.
fig.2. 1977 (southern part)
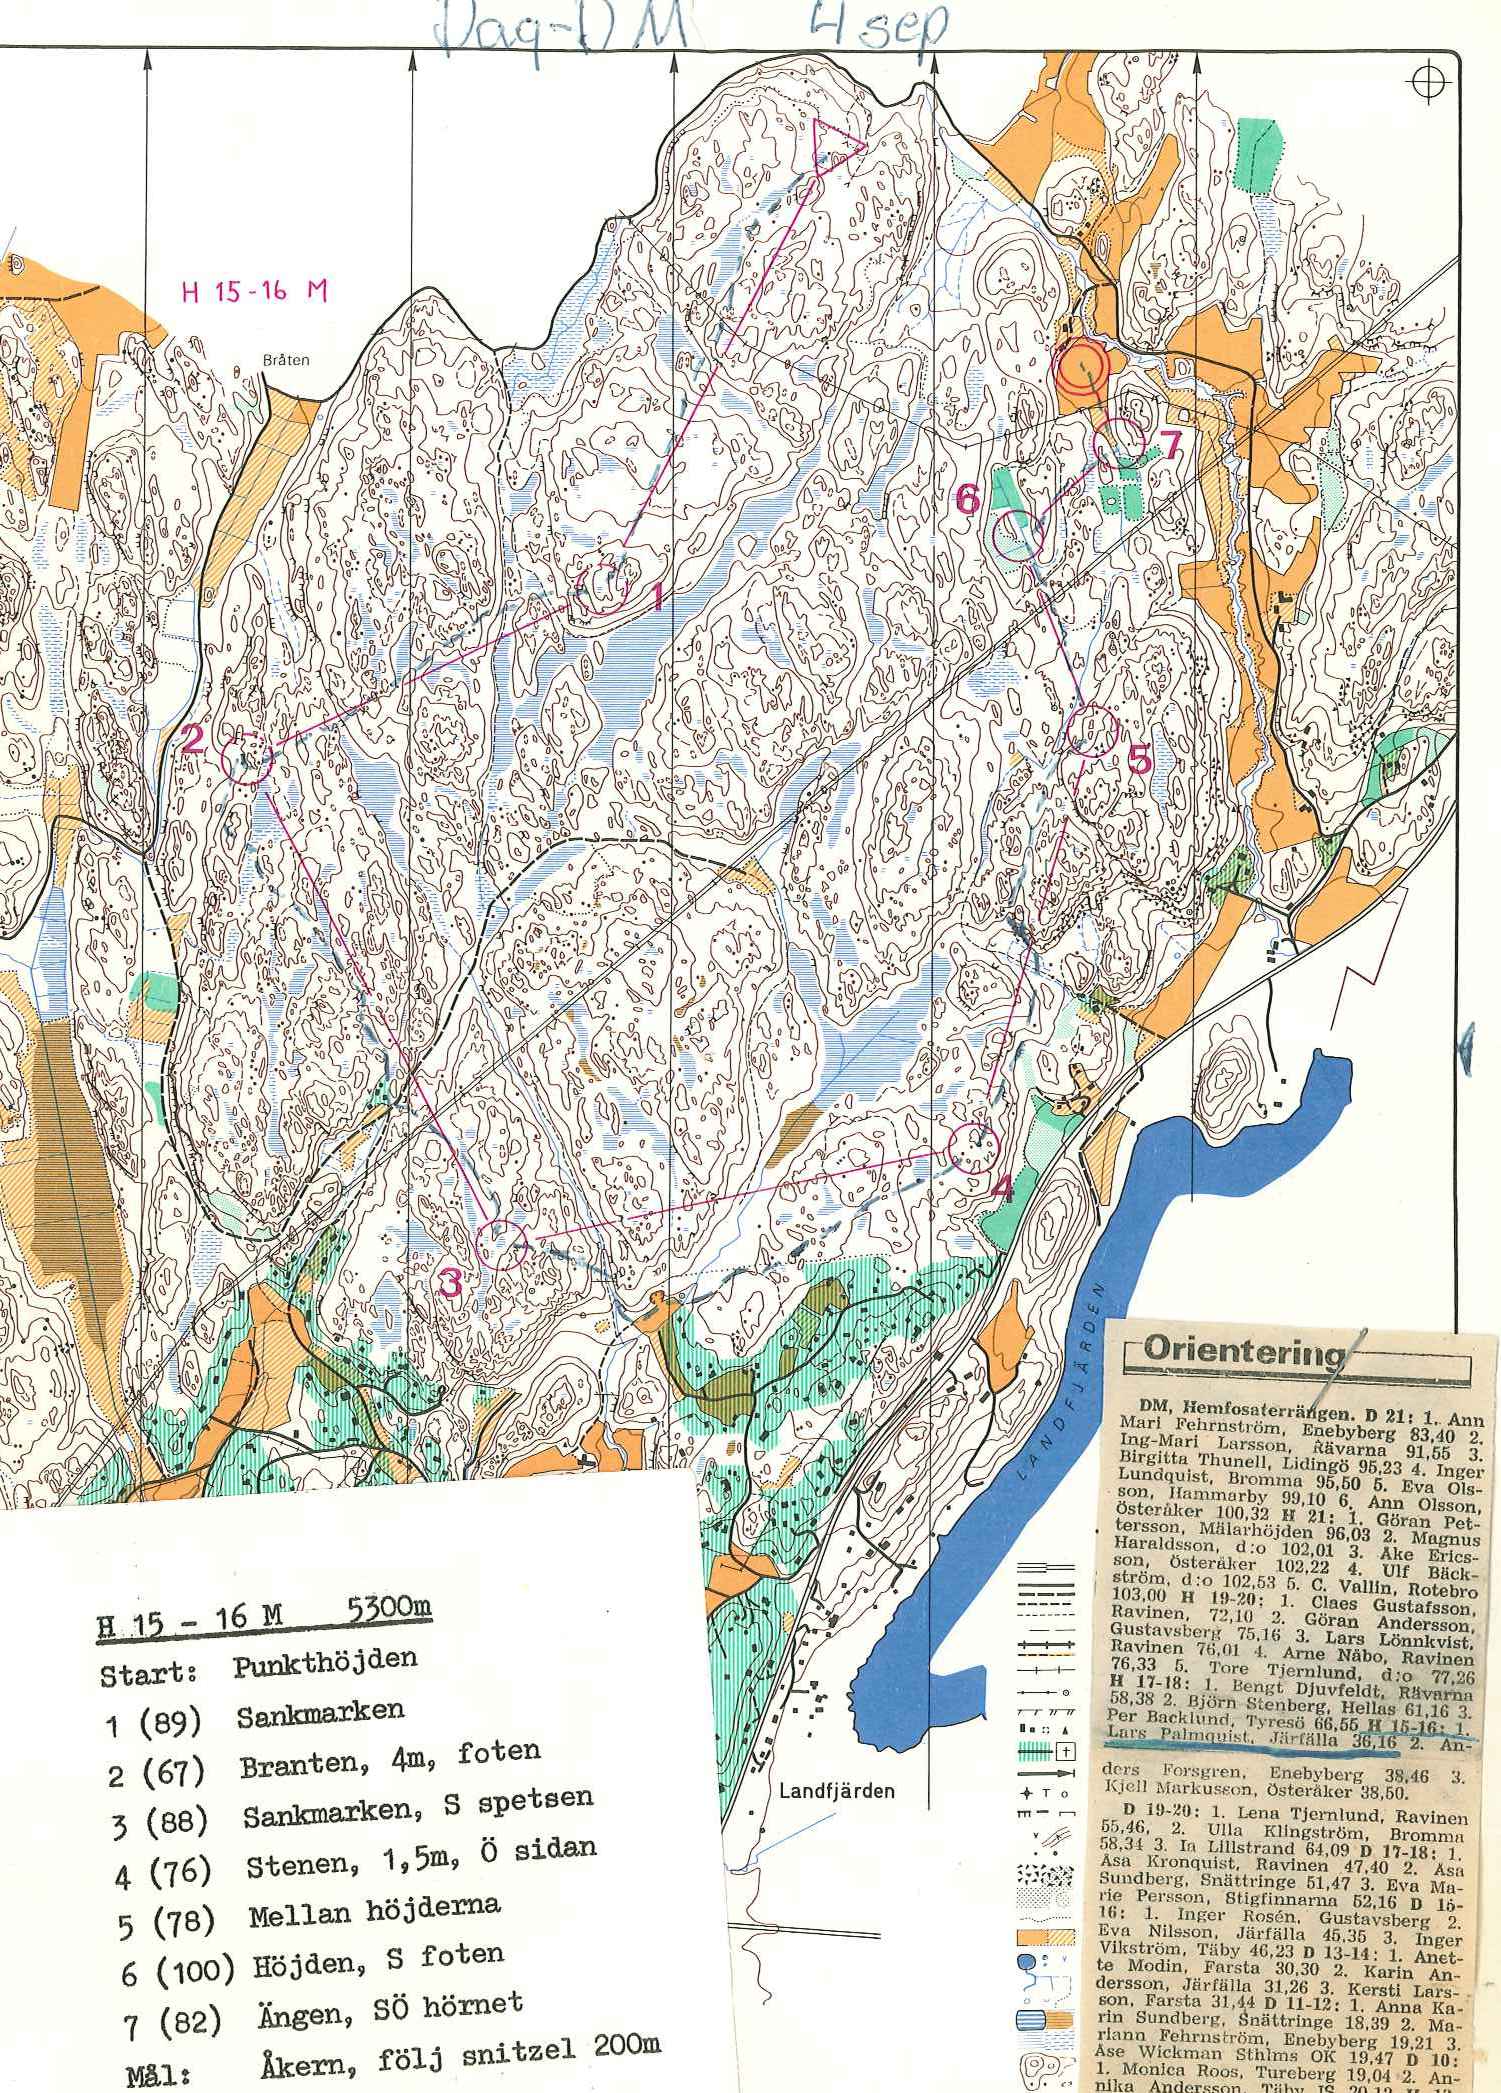
1981 a new map again. It seems the 1977 was revised and more standardized signatures (f.ex. rock faces) where applied.
fig.3.1981 (northern part)
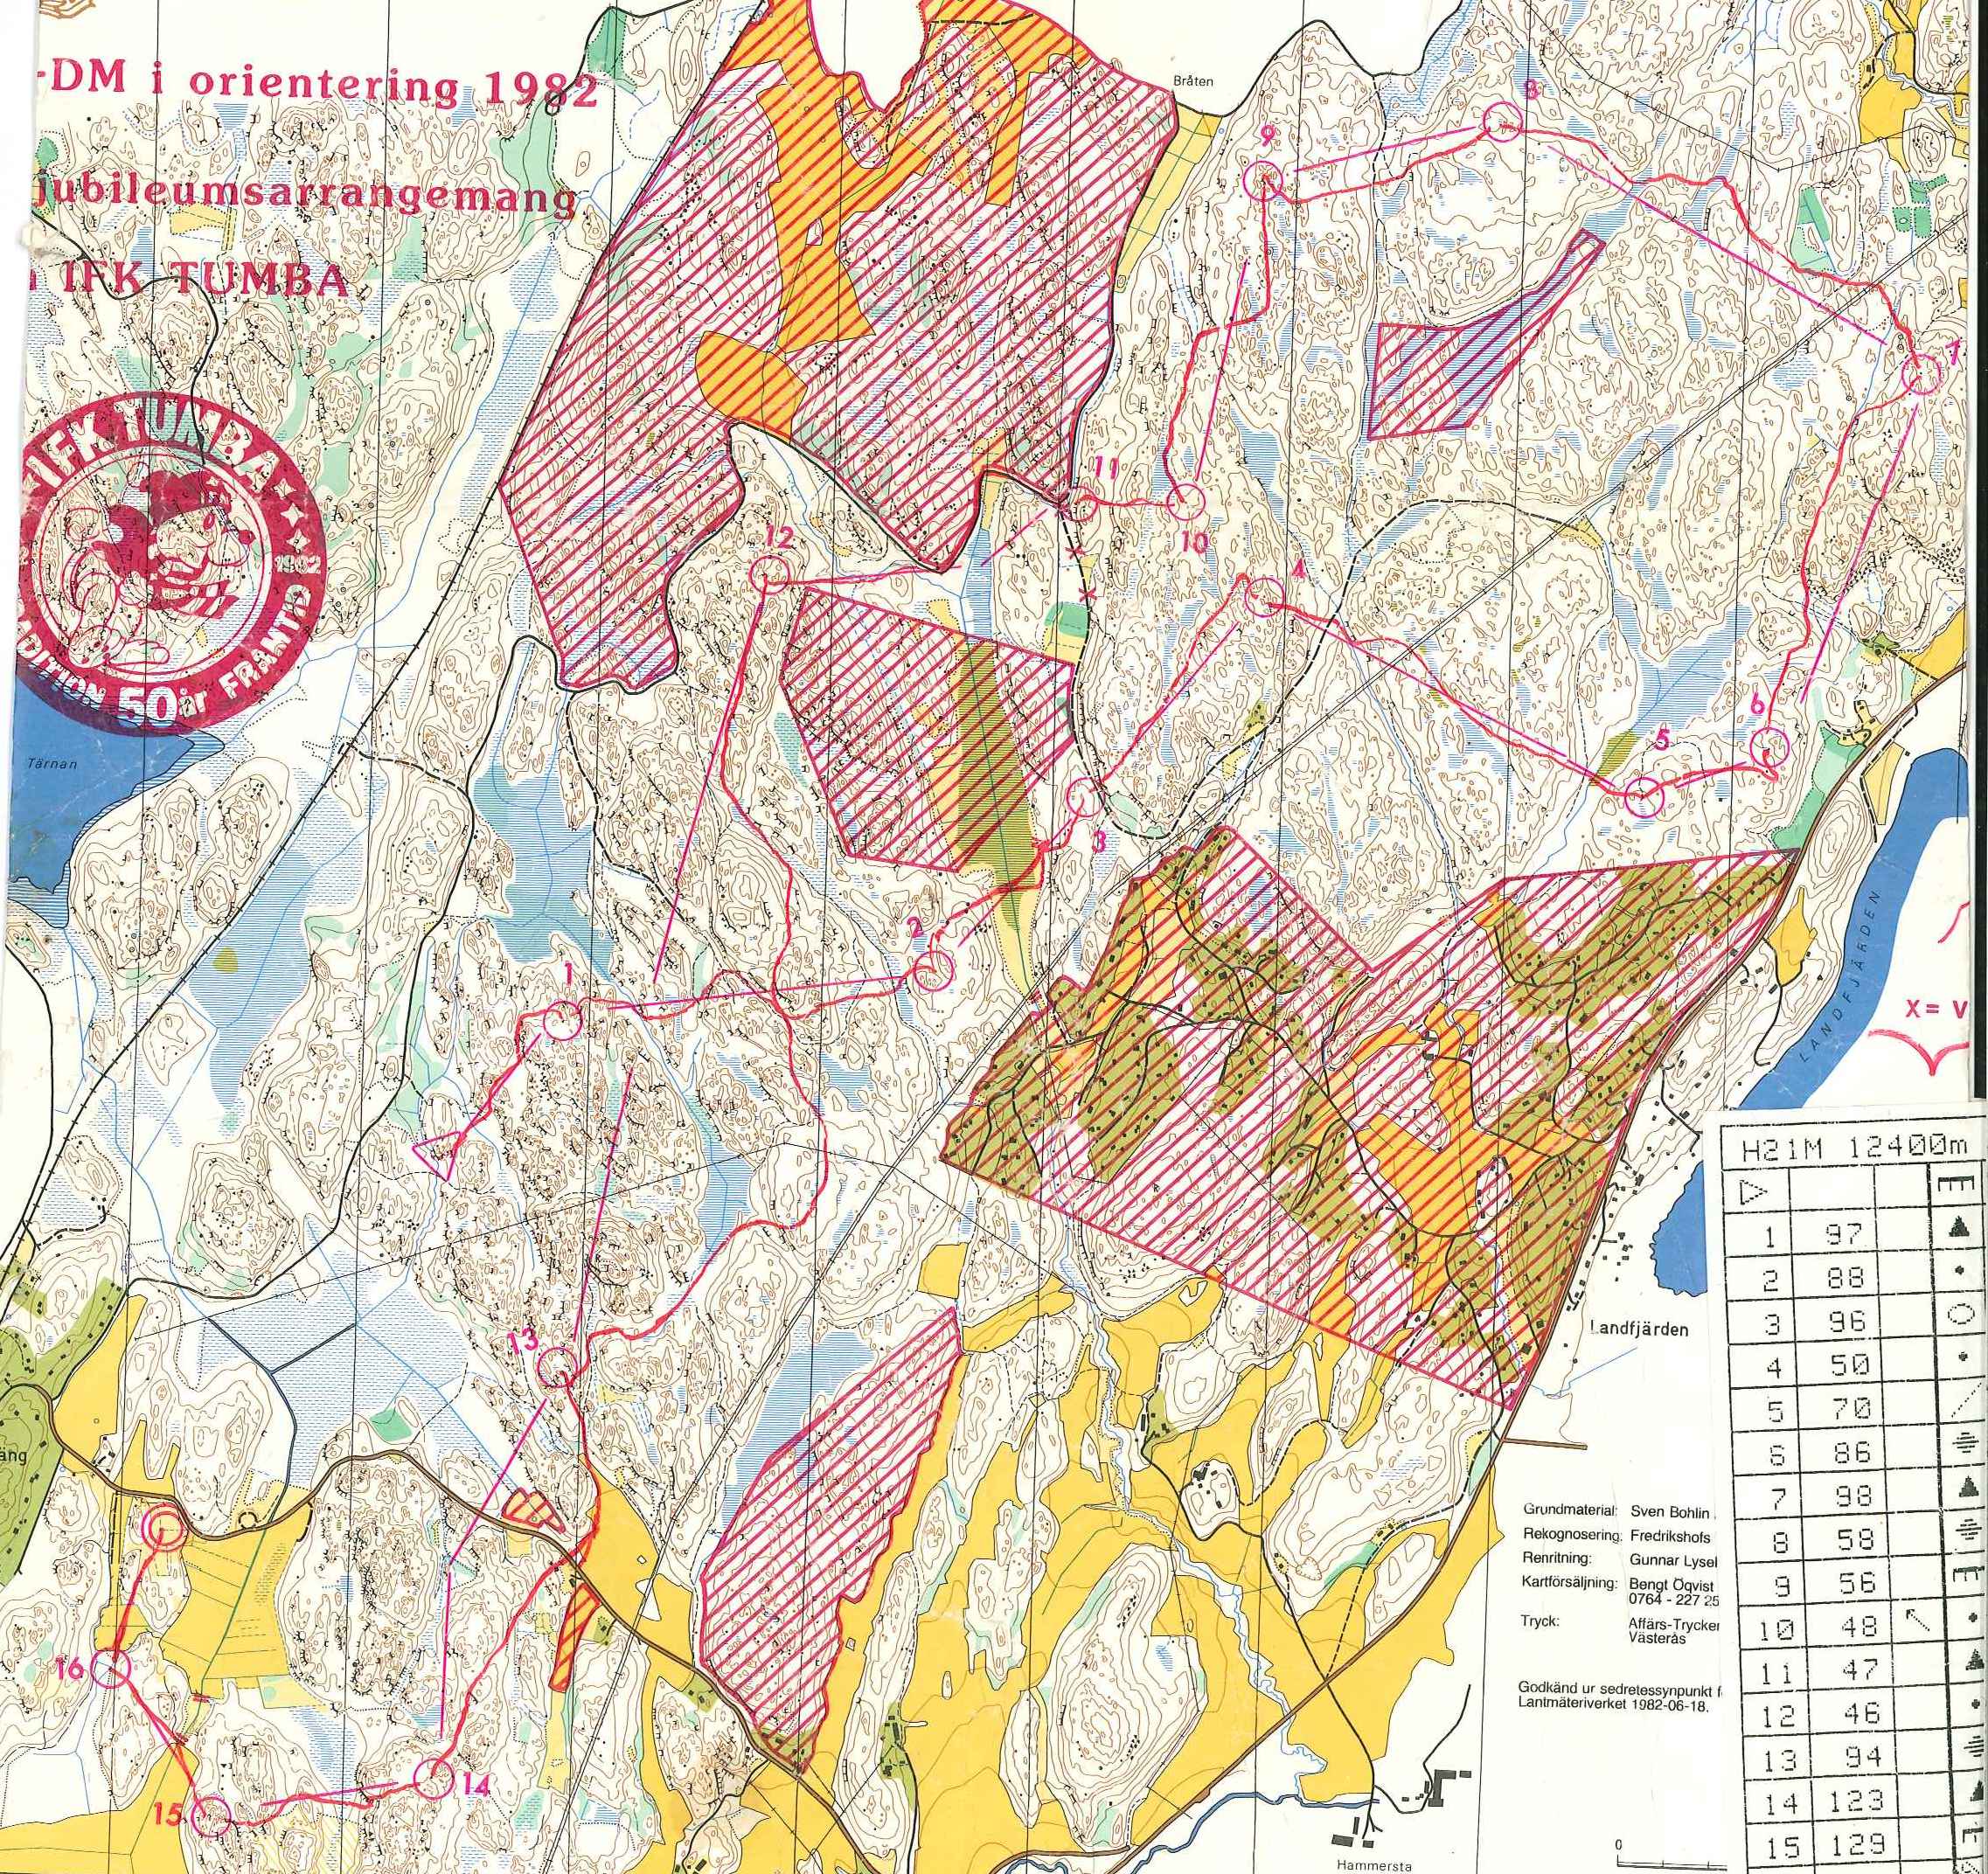
And already in 1982 the next revision with once more standardized signatures (f.ex. single tracks; ISOM 1982?). Here we get for the first time a glimpse on the authors: Basematerial: Sven Bohlin, Fieldwork: Fredrikshofs [IF, Tyresö], Drawing: Gunnar Lysel[l]
fig.4. 1982 (southern part).
Then in 1992 a new map, according to ISOM 1990 (the green stripes ISOM) and "digitally produced". This map was sort of a pre-map to the later SM-map. Parts of this map also appear in the latter being produced 1993-1994.
fig.5. 1992 (southern part)
History of the current map
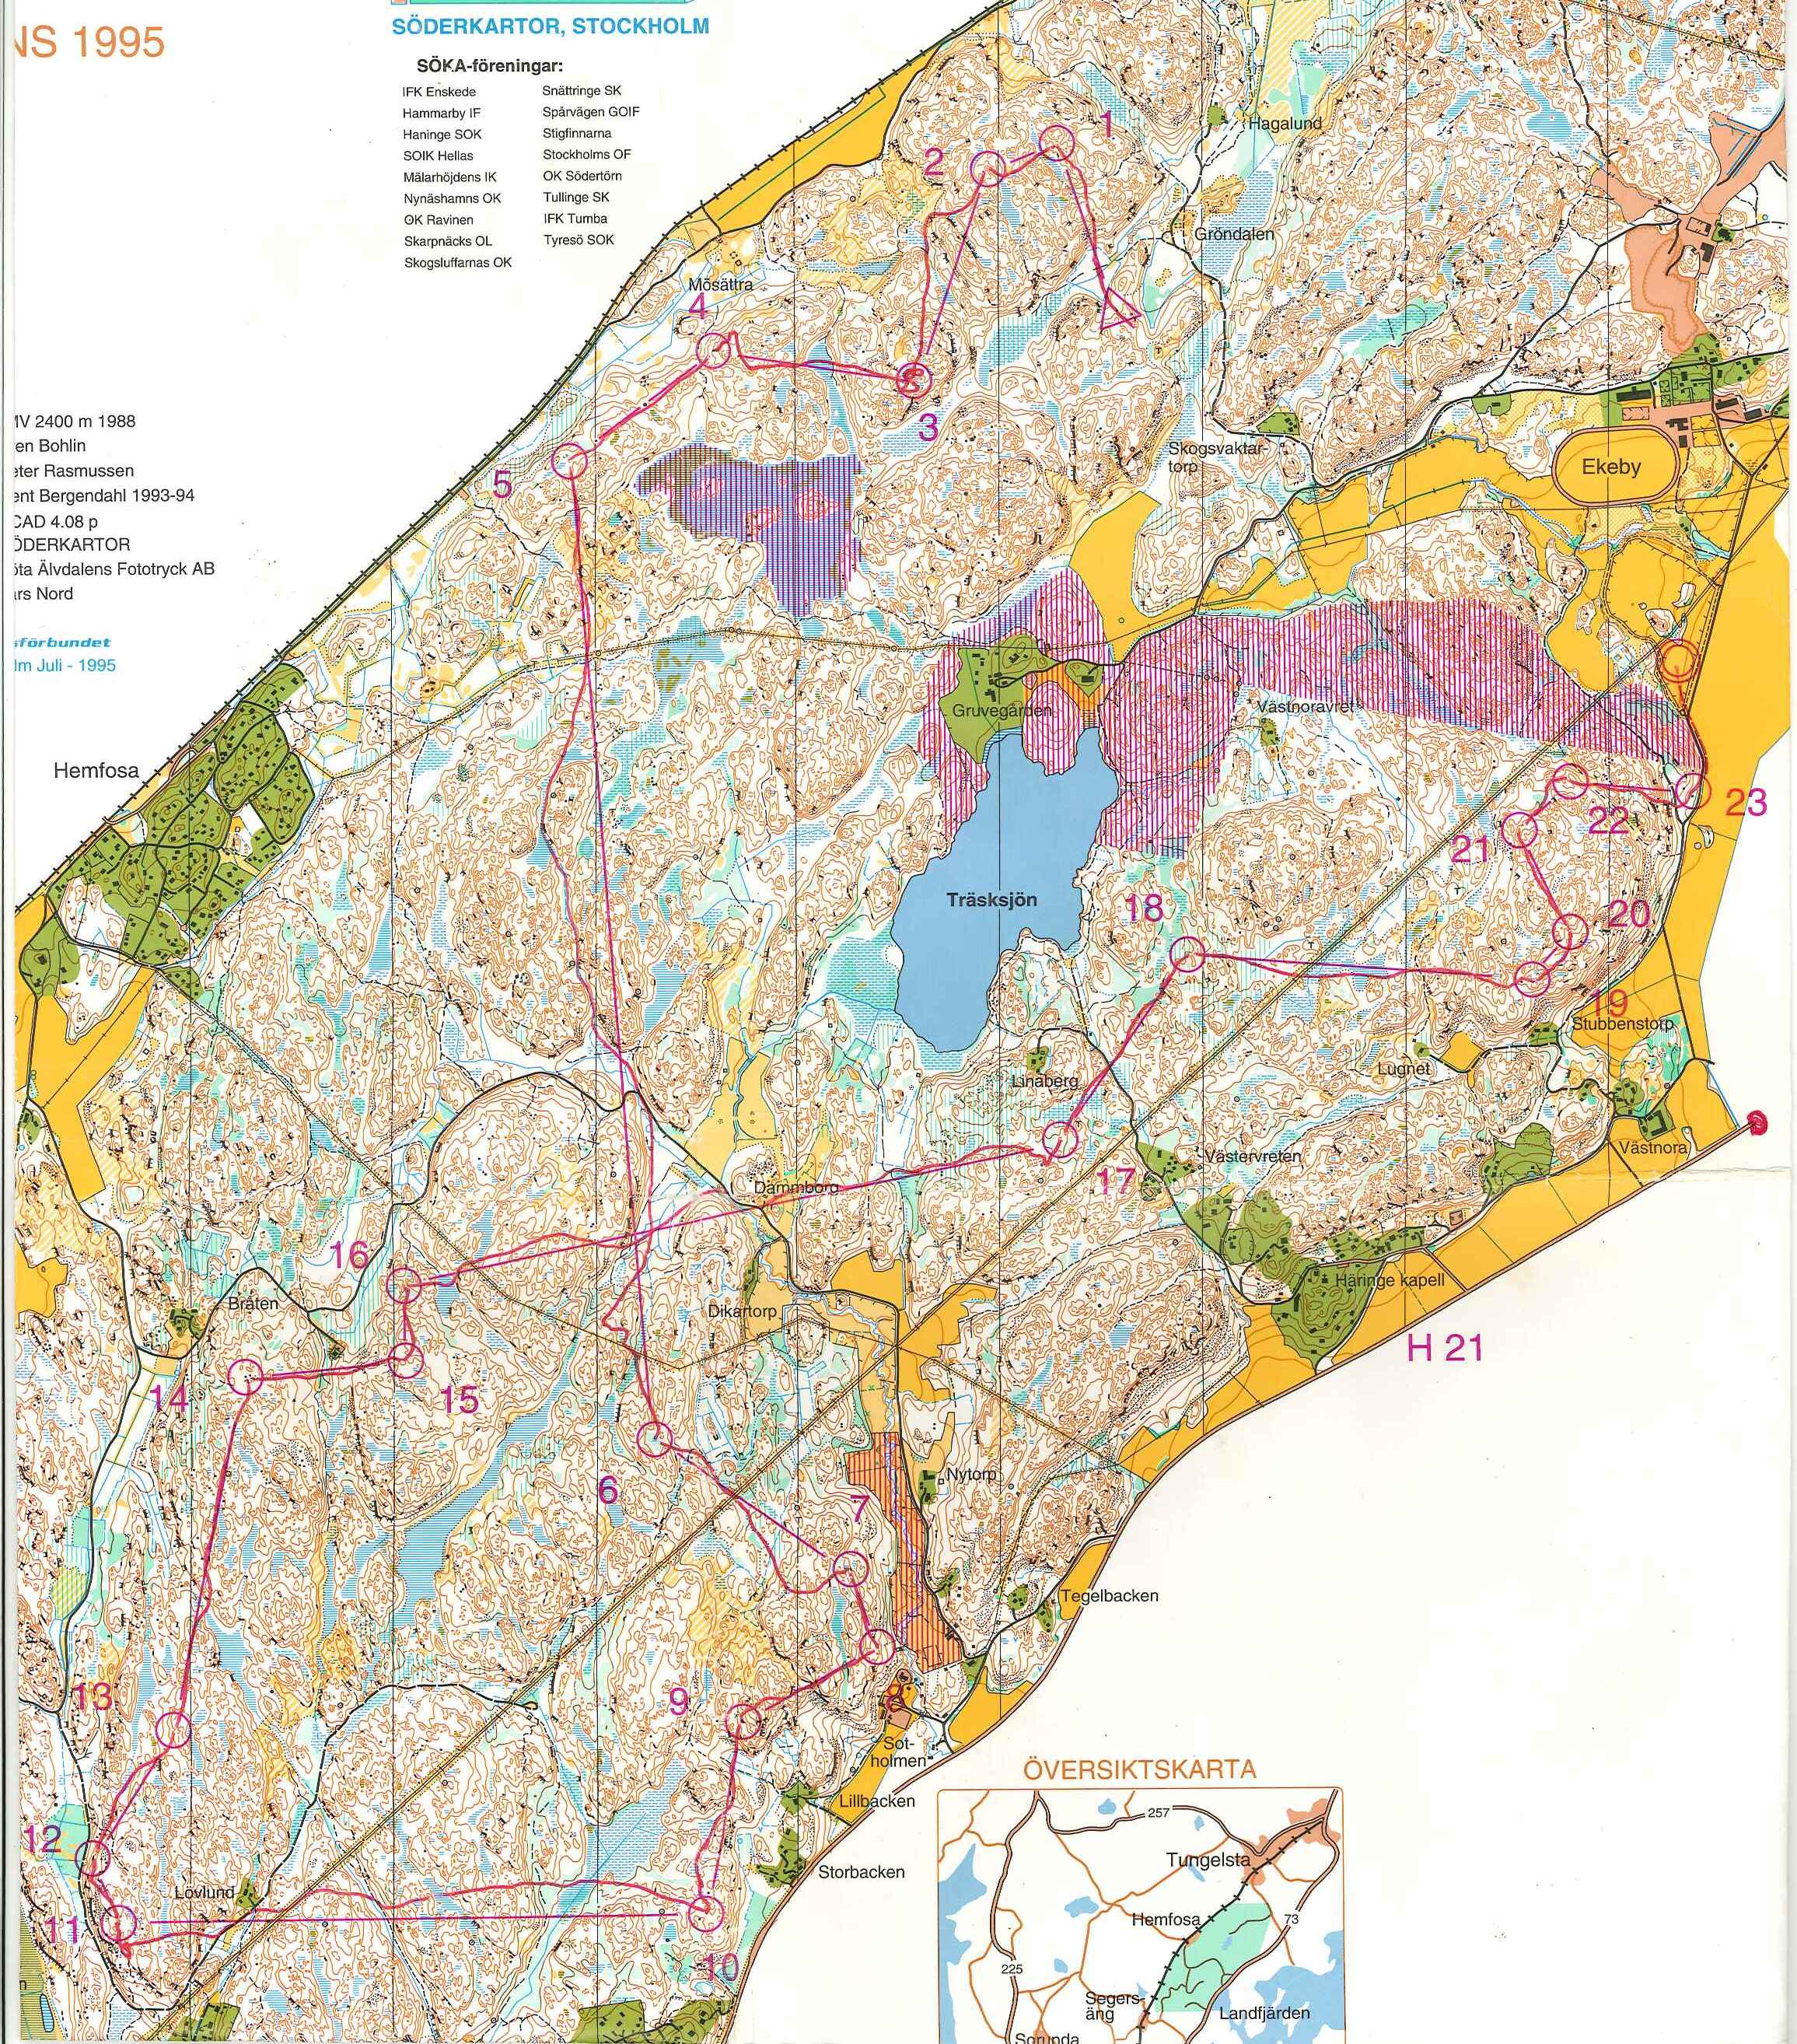
In 1993-1994 the map I am revising was produced for the Swedish Long Distance Championships. The map was based on Sven Bohlins Base-Material he extracted from airborne images (2400m) from 1988. Peter Rasmussen did the fieldwork. Kent Bergendahl the digitization with OCAD 4.0p (on later excerpts of the map Bergendahl was also credited for fieldwork as Rasmussen for digitization and finally only Bergendahl was mentioned).
fig.7. 1995 (center part)
This map was revised by Bertil Lundkvist in 2006 and thereby adapted the ISOM 2000 (the elongated knoll revision).
fig.9. 2006 (northern part)
In regard of the map broadly merited Lundkvist did a good job. In regard of the drawing he
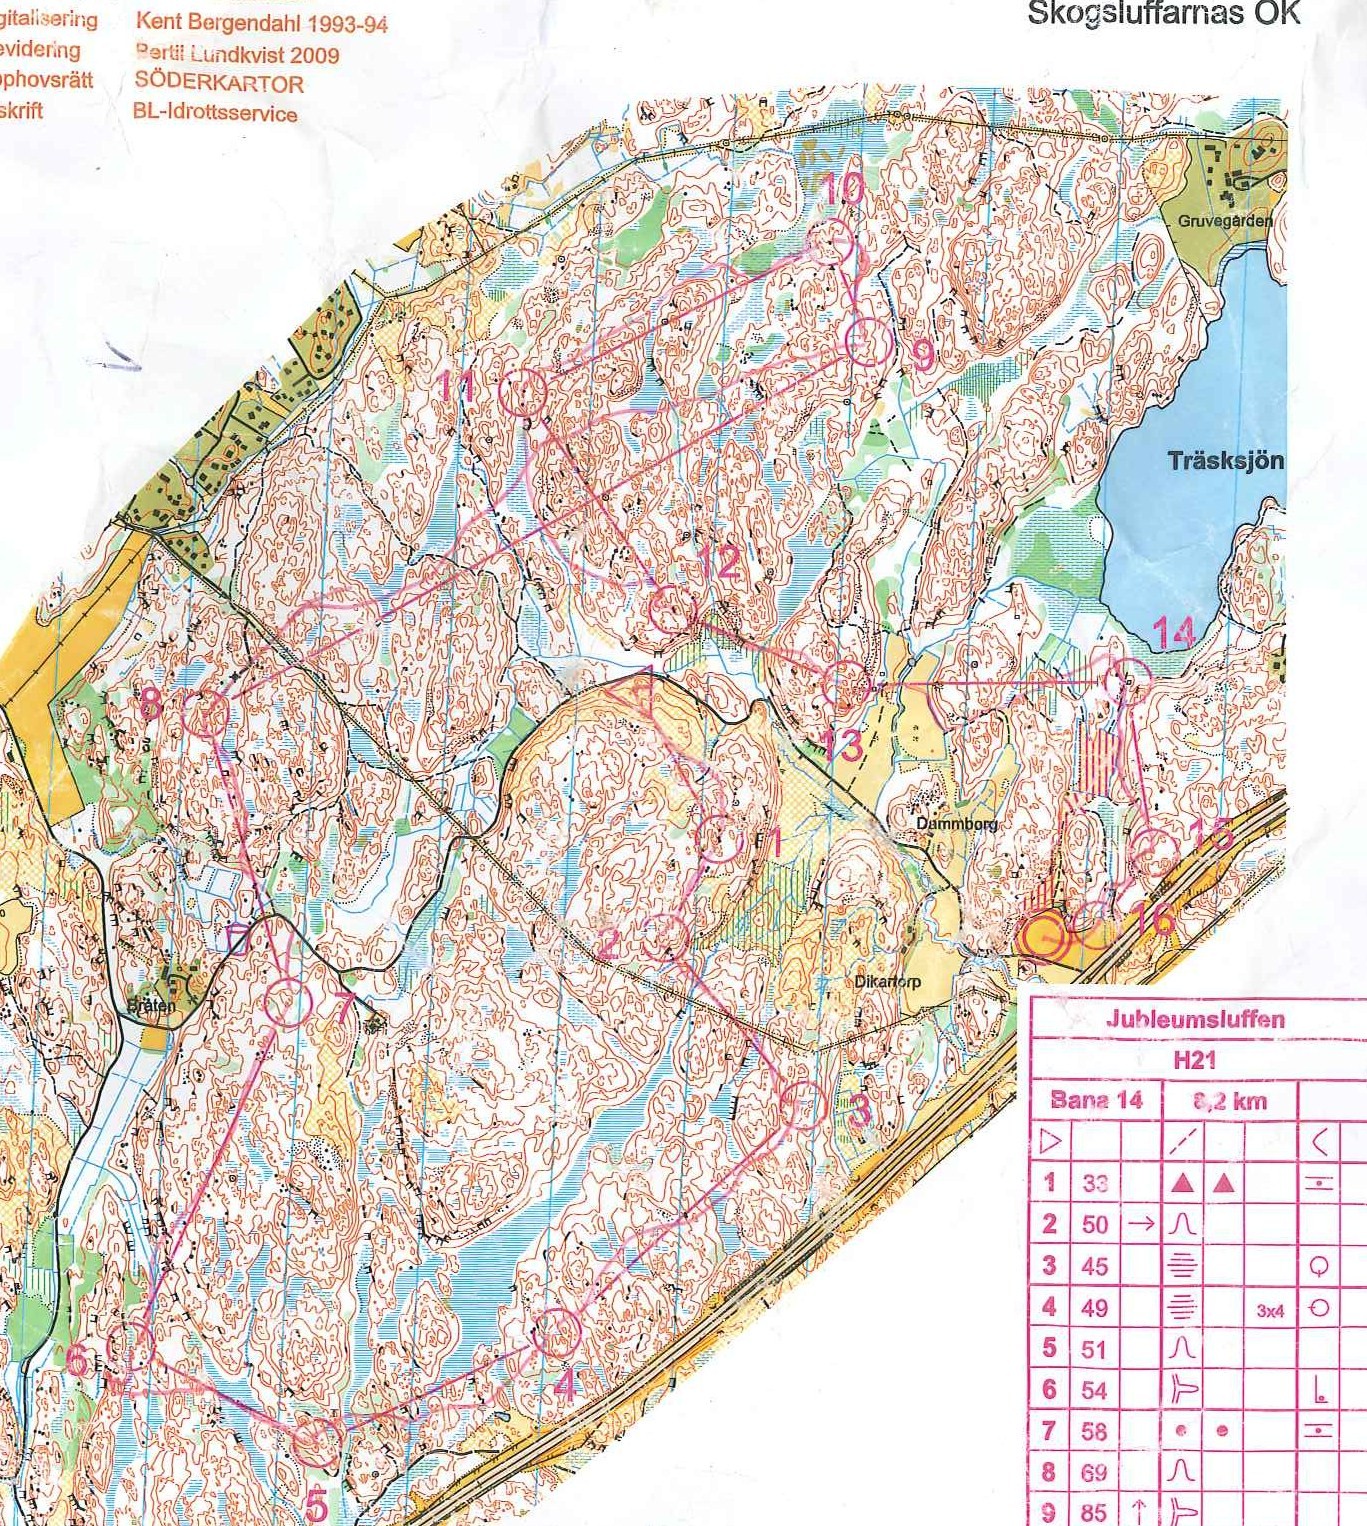
Lundkvist revised the map once again in 2009 as a new motorway crossing the forest was build. This revision seems to have been strictly limited to the necessary, leaving obvious lacks outside these limits.
fig.11. 2009
Summary
The map has a long history and the maps basic quality is very high.
The maintenance of the drawing is nowadays a crucial task to a mapper, and a clients investment into the maps future. Therefore the drawing should be enhanced.
Then, the readability should be enhanced by pushing through the existing minimal measures and minimal gaps.
And of course, it is time for a smooth revision...
based on Lars Palmqvists Map Archive
The area I am working today was first mapped before 1971 in a scale of 1:20'000 and 2.5m intervall by SoIK Hellas (no single authors mentioned).
fig.1. 1971
The map itself did not follow any international standard.
In 1977 a new map according to ISOM1975 with its new palette of runnability signatures (yellow and green) appeared.
fig.2. 1977 (southern part)
1981 a new map again. It seems the 1977 was revised and more standardized signatures (f.ex. rock faces) where applied.
fig.3.1981 (northern part)
And already in 1982 the next revision with once more standardized signatures (f.ex. single tracks; ISOM 1982?). Here we get for the first time a glimpse on the authors: Basematerial: Sven Bohlin, Fieldwork: Fredrikshofs [IF, Tyresö], Drawing: Gunnar Lysel[l]
fig.4. 1982 (southern part).
Then in 1992 a new map, according to ISOM 1990 (the green stripes ISOM) and "digitally produced". This map was sort of a pre-map to the later SM-map. Parts of this map also appear in the latter being produced 1993-1994.
fig.5. 1992 (southern part)
History of the current map
In 1993-1994 the map I am revising was produced for the Swedish Long Distance Championships. The map was based on Sven Bohlins Base-Material he extracted from airborne images (2400m) from 1988. Peter Rasmussen did the fieldwork. Kent Bergendahl the digitization with OCAD 4.0p (on later excerpts of the map Bergendahl was also credited for fieldwork as Rasmussen for digitization and finally only Bergendahl was mentioned).
fig.7. 1995 (center part)
- The map was according to the ISOM 1990 and of outstanding quality mostly in regard of the relief interpretation (based on airborne image combined with a very experienced interpreter, Sven Bohlin). This is probably a quality we have a hard time to reach due the luxury of the airborne laser data.
- The drawing instead has from the todays point of view some weak points.
- OCAD 4.0p did probably not support bezier-curves, so everthing had to be drawn "dotted". This makes the file very unhandy for revisions.
- The whole map seems to be "thought from the airborne image". Everything was more or less placed disregarding symbol sizes as, minimal distances between objects. This has negative impacts on the maps readability.
- Due to the primacy of the base-material and probably some limitations of OCAD 4 objects like 103 form line where not drawn with their according symbol but every single dash with 101 contour. Similar for 307 minor water channel. Also other object like 104 slope line, 515 railway, 516 powerline, 512 footbridge, 312 well where drawn with non-according symbols. This makes the file unhandy for revisions of map specifications.
This map was revised by Bertil Lundkvist in 2006 and thereby adapted the ISOM 2000 (the elongated knoll revision).
fig.9. 2006 (northern part)
In regard of the map broadly merited Lundkvist did a good job. In regard of the drawing he
- continued "dotting"
- added new missymbolisations like filling small hills drawn with 101 contour which should according to ISOM2000 be converted to 113 elongated knoll with dots of 117 broken ground or 112 small knoll instead. Therby he avoided to introduce the minimal measures for small knolls.
Lundkvist revised the map once again in 2009 as a new motorway crossing the forest was build. This revision seems to have been strictly limited to the necessary, leaving obvious lacks outside these limits.
fig.11. 2009
Summary
The map has a long history and the maps basic quality is very high.
The maintenance of the drawing is nowadays a crucial task to a mapper, and a clients investment into the maps future. Therefore the drawing should be enhanced.
Then, the readability should be enhanced by pushing through the existing minimal measures and minimal gaps.
And of course, it is time for a smooth revision...
Freitag, 22. März 2013
Mappers Blog: ISOM2000 from the perspective of the typical succession as result of swedish forestry
Added 27.03.2013: As you can see here, the next ISOM is about to solve my problems with narrow rides as the semi-open terrain.(Page 19 & 20)
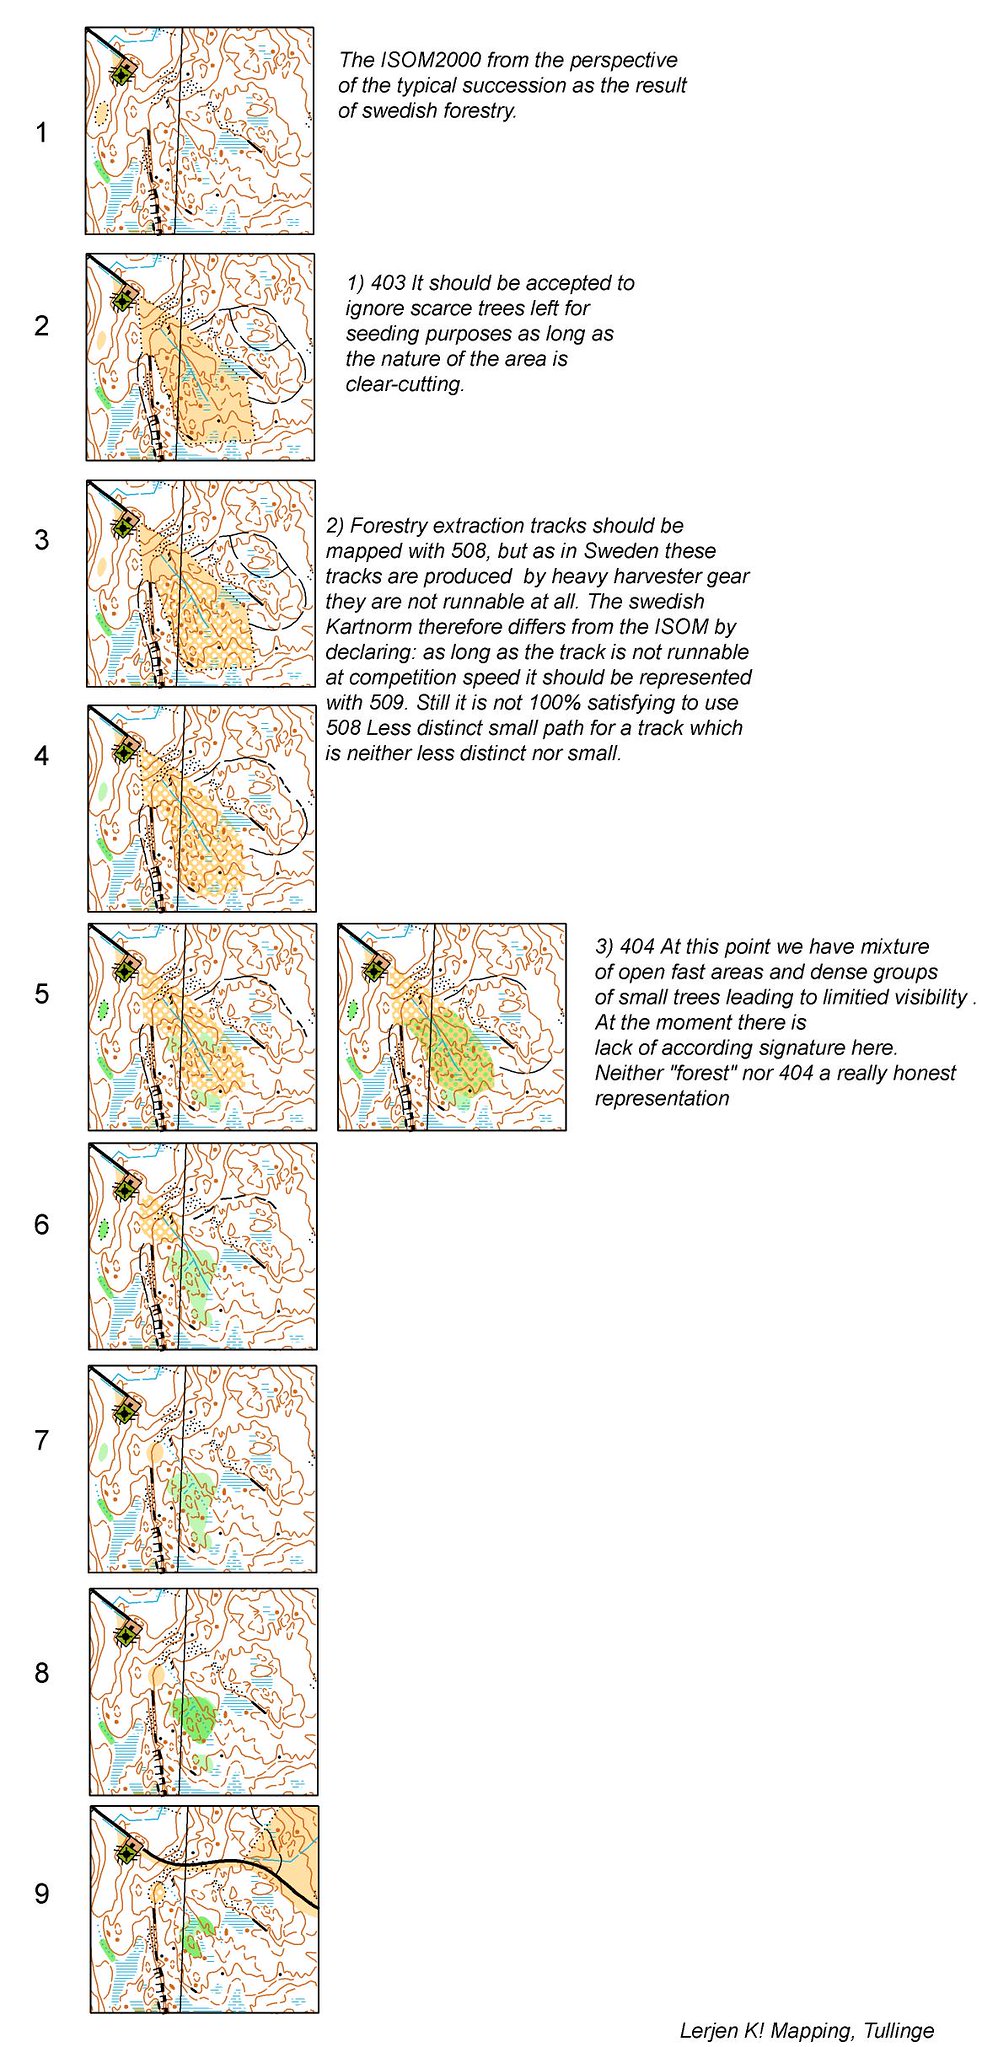
fig.1 Stage 2. Rather fresh result of a swedish-style clear-cutting. From the perspective that the map is a piece of graphical communication I would prefer map this as 403, even though there are a small number of trees here.
During my Hemfosa-Project I noticed, that I mainly have to deal with two kinds of forest, which are natural forest (naturskog) and cultivated forest (kulturskog). Where natural forest is mainly "white" or predictable, the cultivated forest leading to complex green patterns is the harder job. Forest in Sweden is mainly cultivated in two forms nowadays: clear-cutting bigger areas and harvester-rides. Earlier they also cultivated plantation, but this seems not anymore. As these two main-usages are applied for quite a while I saw different stages of a the typical succession from these two forms and put it together from the perspective of the ISOM2000.
There are three points I am reguarly struggling joining swedish forestry with the ISOM2000. See my comments in graph.
fig.3. Stage 5
fig.4. Less distinct small path?
Dienstag, 19. März 2013
Mappers Blog: The View from my office window today
Abb.1. The view through my "office" window today. Thinking about, I always wanted such an outdoor job. (+10cm snow)
Montag, 18. März 2013
Mappers Blog: Aufnahme im Gelände
Als Kartierungsgrundlage verwende ich die Karte Stand zwischen 1995 und 2009 versehen mit einem Netz zum einfachen einpassen bei der Reinzeichnung (OCAD>Karte>Gitterlinen). Für die Karte habe ich versucht der Karte einerseits Farben neu zuzuteilen, die einen grossen Kontrast zu den von mir verwendeten Stiften bilden, andererseits muss das Symbol des Objektes noch identifizierbar sein (Kuppe oder grosser Stein?; OCAD>Datei>speichern unter [hemfosa_baskarta.ocd]; OCAD>Karte>Farben).
Die Grundlage drucke ich im Massstab 1:7500 (Zielkarte 1:15000) auf Papier. Dann klebe ich dieses auf eine 2mm starke Plexiglasplatte und überziehe es mit einem selbstklebendem Zeichungsfilm (genaue Typenbezeichnung folgt, zu kaufen gibt es den bei der Materialstelle des SOLV)
Die Plexiglasplatte ist eigentlich zu dünn, insbesondere im Winter, da sie mit den Handschuhen gehalten werden muss. Die ersten Tage habe ich darum jeweils zum Schluss Schmerzen an der linken Schulter.
Feldmaterial vom ersten Tag: Proviant, Sonnenschutz, Karte 2009 1:15K, Telefon, Geld, Zeichungsgrundlage, Minenbleistifte mit Brusthalfter (eben erst den Tschechen abgeguckt), Ersazmaterial, Kompass, GPS Garmin Oregon (zu mitteln von Referenzpunkten zur Georeferenzierung der Karte), GPS Garmin Forerunner 205 (zur Aufzeichnung meiner Wege).
Detail: Brusthalfter (Prototyp)
Detail: Druckbleistifte mit Pentel und Staedler Farbminen 0.5mm (Ich arbeite primär mit rot, gelb, grün und schwarz/Bleistift.
Auf geht es. Leichte Winterschuhe (Timberland), Gamaschen (Mammut), warme Fingerhandschuhe (Black Diamond), leichte Skihosen (killy), Faserpelz (HH), Gore-Tex-Jacke (Moonstone), Sonnenbrille (Bolle), Mütze (Icebreaker) und Rucksack (Black Diamond).
Feldperspektive.
Feldaufnahme vom ersten Tag. Es ist ein Wiedereinstieg. Ich merke beim zeichnen, dass ich viel nicht eindeutig gezeichnet habe (gezeichnet -> geändert ->geändert->unlesbar). Das wiederum wirkt sich negativ auf das flüssige Arbeiten an der Reinzeichnung aus. Mit Blick auf Jiris sauberen Zeichnungsstil nehme ich vor mich dahingehend zu verbessern (nur definitives zeichnen, bzw. Änderungen mittels Gummi und Abdeckstift direkt vor Ort klarzustellen).
Die Grundlage drucke ich im Massstab 1:7500 (Zielkarte 1:15000) auf Papier. Dann klebe ich dieses auf eine 2mm starke Plexiglasplatte und überziehe es mit einem selbstklebendem Zeichungsfilm (genaue Typenbezeichnung folgt, zu kaufen gibt es den bei der Materialstelle des SOLV)
Die Plexiglasplatte ist eigentlich zu dünn, insbesondere im Winter, da sie mit den Handschuhen gehalten werden muss. Die ersten Tage habe ich darum jeweils zum Schluss Schmerzen an der linken Schulter.
Feldmaterial vom ersten Tag: Proviant, Sonnenschutz, Karte 2009 1:15K, Telefon, Geld, Zeichungsgrundlage, Minenbleistifte mit Brusthalfter (eben erst den Tschechen abgeguckt), Ersazmaterial, Kompass, GPS Garmin Oregon (zu mitteln von Referenzpunkten zur Georeferenzierung der Karte), GPS Garmin Forerunner 205 (zur Aufzeichnung meiner Wege).
Detail: Brusthalfter (Prototyp)
Detail: Druckbleistifte mit Pentel und Staedler Farbminen 0.5mm (Ich arbeite primär mit rot, gelb, grün und schwarz/Bleistift.
Auf geht es. Leichte Winterschuhe (Timberland), Gamaschen (Mammut), warme Fingerhandschuhe (Black Diamond), leichte Skihosen (killy), Faserpelz (HH), Gore-Tex-Jacke (Moonstone), Sonnenbrille (Bolle), Mütze (Icebreaker) und Rucksack (Black Diamond).
Feldperspektive.
Mappers Blog: Schneelage Anfang März 2013
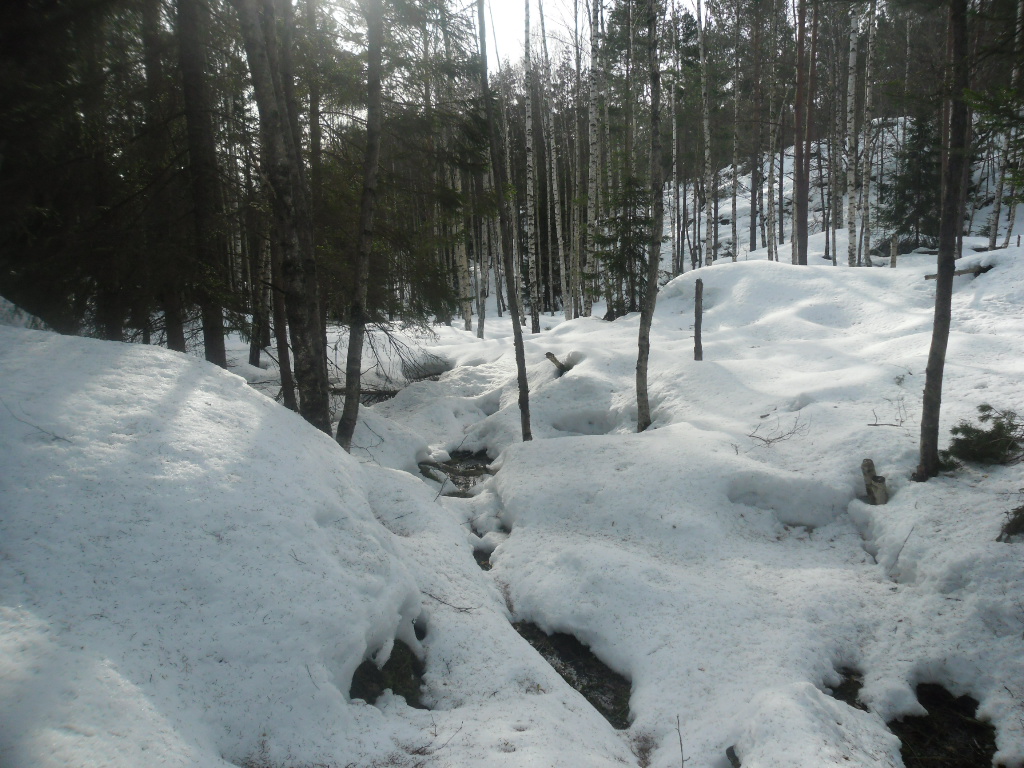
Der Winter war auch hier in Stockholm ungewöhnlich schneereich, so dass auch weiterhin gut 20cm Schnee im Laufgebiet liegt. Weil ich nun nicht mehr länger zuwarten kann, revidiere ich nun trotz Schnee.
Die Grobrevision der Vegetationskartierung kann ich dabei gut vornehmen, die Beurteilung der Traktorschneisen und Wege (Bilder 3 und 4) ist dagegen schwierig.
Es zeigt sich, dass die herrschenden Verhältnisse nicht übel sind, da der Schnee über Nacht immer wieder einen zumindest teilweise tragenden Deckel friert.
Die Grobrevision der Vegetationskartierung kann ich dabei gut vornehmen, die Beurteilung der Traktorschneisen und Wege (Bilder 3 und 4) ist dagegen schwierig.
Es zeigt sich, dass die herrschenden Verhältnisse nicht übel sind, da der Schnee über Nacht immer wieder einen zumindest teilweise tragenden Deckel friert.
Donnerstag, 14. März 2013
Mappers Blog: Der Auftrag
Ende November 2012 treffe ich mich mit zwei Vertretern des Kartenzusammenschlusses SöKa (Söder Kartor) an welchem alle Vereine angeschlossen sind, die in der Region südlich von Stockholm OL-Karten besitzen. SöKa bewirtschaftet diese Karten zentral.
Ich soll im Hinblick auf zwei Wettkämpfe Ende April 2013 einen 11km2 Auschnitt der Karte Hemfosa, ein Gebiet rund 30km südlich von Stockholm, grob überarbeiten. Das ganze läuft unter dem Begriff der ytrevidering und wird mit 8-10h/km2 veranschlagt.
Dazu kommt der Auftrag, die Karte an die neue schwedische Kartennorm (plusminus die schwedische Übersetzung der ISOM2007) anzupassen und auf das geltende schwedische Koordinatensystem SWEREF99TM anzupassen.
SOFT-Kartnorm.
Dazu gibt es die lokale SöKa Interpretation der Kartennorm mit zu berücksichtigen.
SöKa-Kartpolicy.
Da in Schweden das Gros der Aufnehmer Profis sind, habe ich im Hinblick auf diesen Auftrag bei den schwedischen Behörden (Skatteverket) eine Einzelfirma im Arbeitsbereich SNI-Kod 71129 angemeldet. Als ein in Schweden unbeschriebenes Blatt beginne ich mit einem Stundenansatz von 300 SEK /ca.43CHF. Ausgewiesene Kartografen bekommen Ansätze bis 400 SEK.
Werden in der Regel die aufgewendeten Stunden ausbezahlt, so vereinbare ich mit SöKa ausnahmsweise einen fixen Beitrag.
Im später stellt sich heraus, dass die Karte 1994 zwar nach höchstem Standard aufgenommen wurde (dazu separater Artikel), die Zeichnung mit damals OCAD 4 aber nicht moderen Standards entspricht, die Symbolsierung und Minimalabstände nicht der aktuellen Kartennorm entsprechen. Ich bekomme darum im Verlauf des Winters den Zusatz-Auftrag die Zeichnung zu bereinigen (dazu separater Artikel).
Ich soll im Hinblick auf zwei Wettkämpfe Ende April 2013 einen 11km2 Auschnitt der Karte Hemfosa, ein Gebiet rund 30km südlich von Stockholm, grob überarbeiten. Das ganze läuft unter dem Begriff der ytrevidering und wird mit 8-10h/km2 veranschlagt.
En modern digitaliserad karta av god kvalitet kan leva längre med enbart ytrevidering. Yttrevidering innebär att man tittar över alla gröna ytor, lägger in nya hyggen, kontrollerar åkrar och ängar och ser över stigsystemet. Den svåraste delen i detta är att göra en jämn redovisning av de gröna ytorna. Ytrevidering kan med fördel läggas ut på duktiga orienterare som är mindre rutinerade som kartritare. Det är viktigt att vi upprätthåller en viss kartritarkompetens i klubbarna.
Dazu kommt der Auftrag, die Karte an die neue schwedische Kartennorm (plusminus die schwedische Übersetzung der ISOM2007) anzupassen und auf das geltende schwedische Koordinatensystem SWEREF99TM anzupassen.
SOFT-Kartnorm.
Dazu gibt es die lokale SöKa Interpretation der Kartennorm mit zu berücksichtigen.
SöKa-Kartpolicy.
Da in Schweden das Gros der Aufnehmer Profis sind, habe ich im Hinblick auf diesen Auftrag bei den schwedischen Behörden (Skatteverket) eine Einzelfirma im Arbeitsbereich SNI-Kod 71129 angemeldet. Als ein in Schweden unbeschriebenes Blatt beginne ich mit einem Stundenansatz von 300 SEK /ca.43CHF. Ausgewiesene Kartografen bekommen Ansätze bis 400 SEK.
Werden in der Regel die aufgewendeten Stunden ausbezahlt, so vereinbare ich mit SöKa ausnahmsweise einen fixen Beitrag.
Im später stellt sich heraus, dass die Karte 1994 zwar nach höchstem Standard aufgenommen wurde (dazu separater Artikel), die Zeichnung mit damals OCAD 4 aber nicht moderen Standards entspricht, die Symbolsierung und Minimalabstände nicht der aktuellen Kartennorm entsprechen. Ich bekomme darum im Verlauf des Winters den Zusatz-Auftrag die Zeichnung zu bereinigen (dazu separater Artikel).
Vor Annahme eines Revisions-Auftrages das OCAD File auf die Zeichenqualität hin beurteilen. Dazu die Kartengeschichte klären (je länger die Karte nicht revidiert wurde, desto grösser der Aufwand).
Abonnieren
Posts (Atom)
o-zeugs over and out (late wc china finding)
Yes. Let the o-zeugs blog rest in peace. I´ll take it down eventually. And yes, I stumbled over the decisions of the Ethics Panel regarding ...
-
I here describe the way of the couch-mapper or with other words how far you can get with a swedish .las file (and karttapullautin , OL Lase...
-
Yes. Let the o-zeugs blog rest in peace. I´ll take it down eventually. And yes, I stumbled over the decisions of the Ethics Panel regarding ...